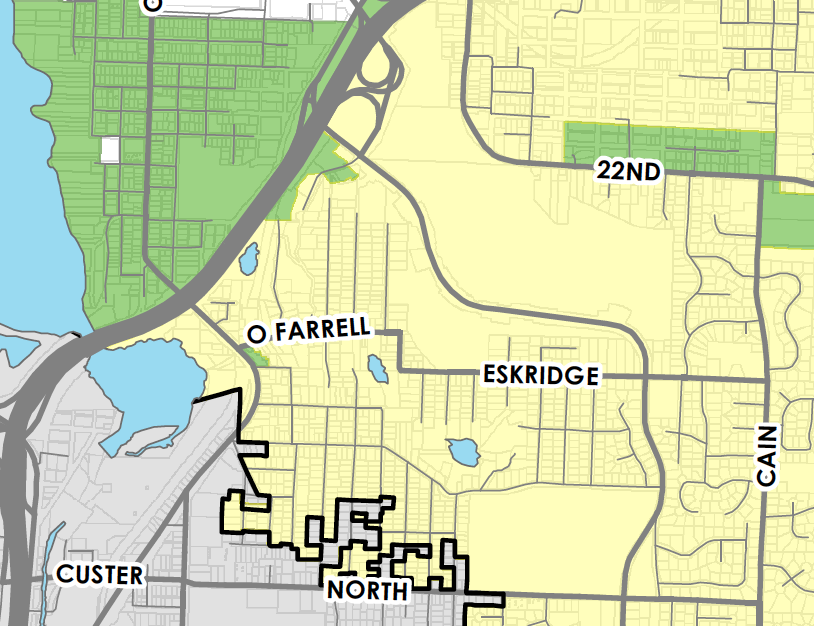
If you go up Eastside Street from downtown, it will eventually curve to the east and become 22nd Avenue. As 22nd Avenue approaches Boulevard, there is a small neighborhood on the left-hand side of the road called Nut Tree Loop.
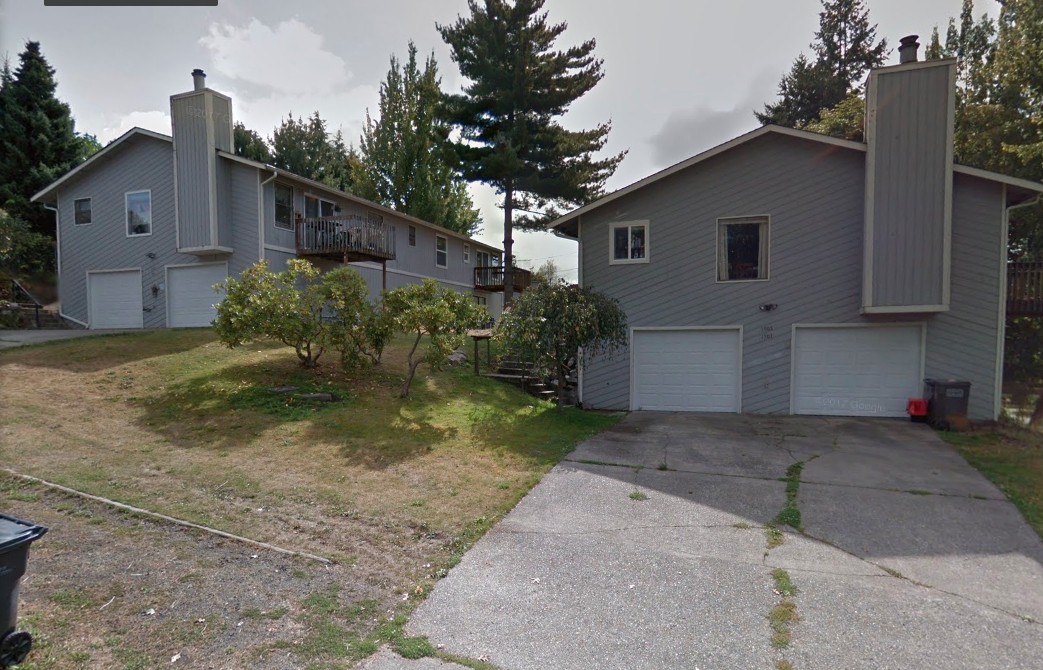
This area around 22nd, Cain Road and Boulevard was the neighborhood I grew up in. I was born in 1976, so in my mind’s eye, I kind of remember Nut Tree Loop being built in the late 70s. And, I’ve always thought about it as a much nicer neighborhood surrounded by blocks of split-level ranch homes and older craftsmen. I think if you take a walk through Nut Tree now, that impression by Kid Emmett still holds true. Two homes recently sold in there for over $700,000 (in 2017) and $800,000 (last May).
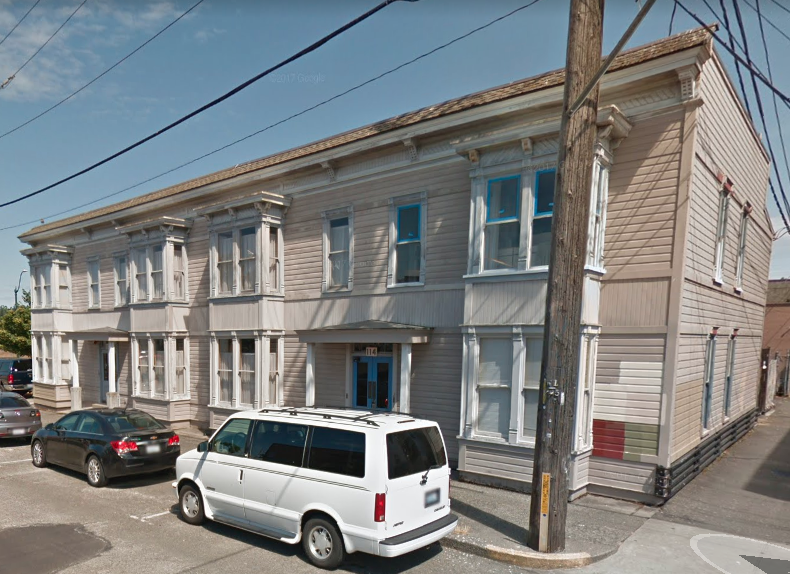
So then, I was startled to find out when Dan Beuhler first envisioned Nut Tree Loop in 1976, he sketched out a neighborhood of 21 fourplexes “across one section of landscaped grounds.” Beuhler had already built a smaller development of apartments around the corner from Nut Tree. At the time called Eidleweiss, they are currently known at the Chateau Townhomes.
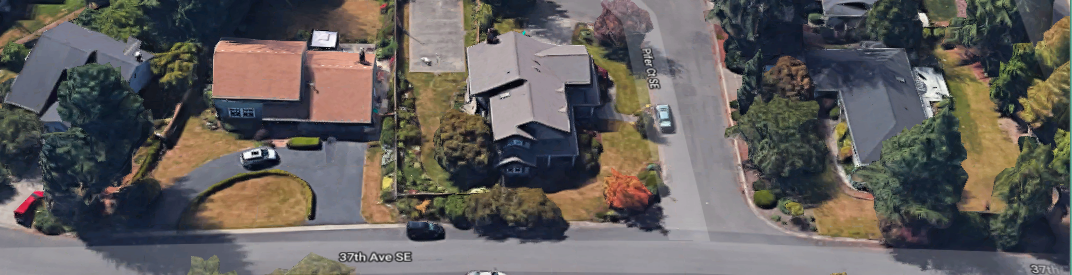
Where 40 or so nicer single-family homes now sit, 84 multi-family units would have been built, if Beuhler got his way. But instead, the Nut Tree fourplexes kicked off several years of debate in Olympia around multi-family housing, the results of which are still felt today.
And the nature of those conversations tells us a lot about why Olympia shut down the development of smaller multi-family housing since the 1980s.
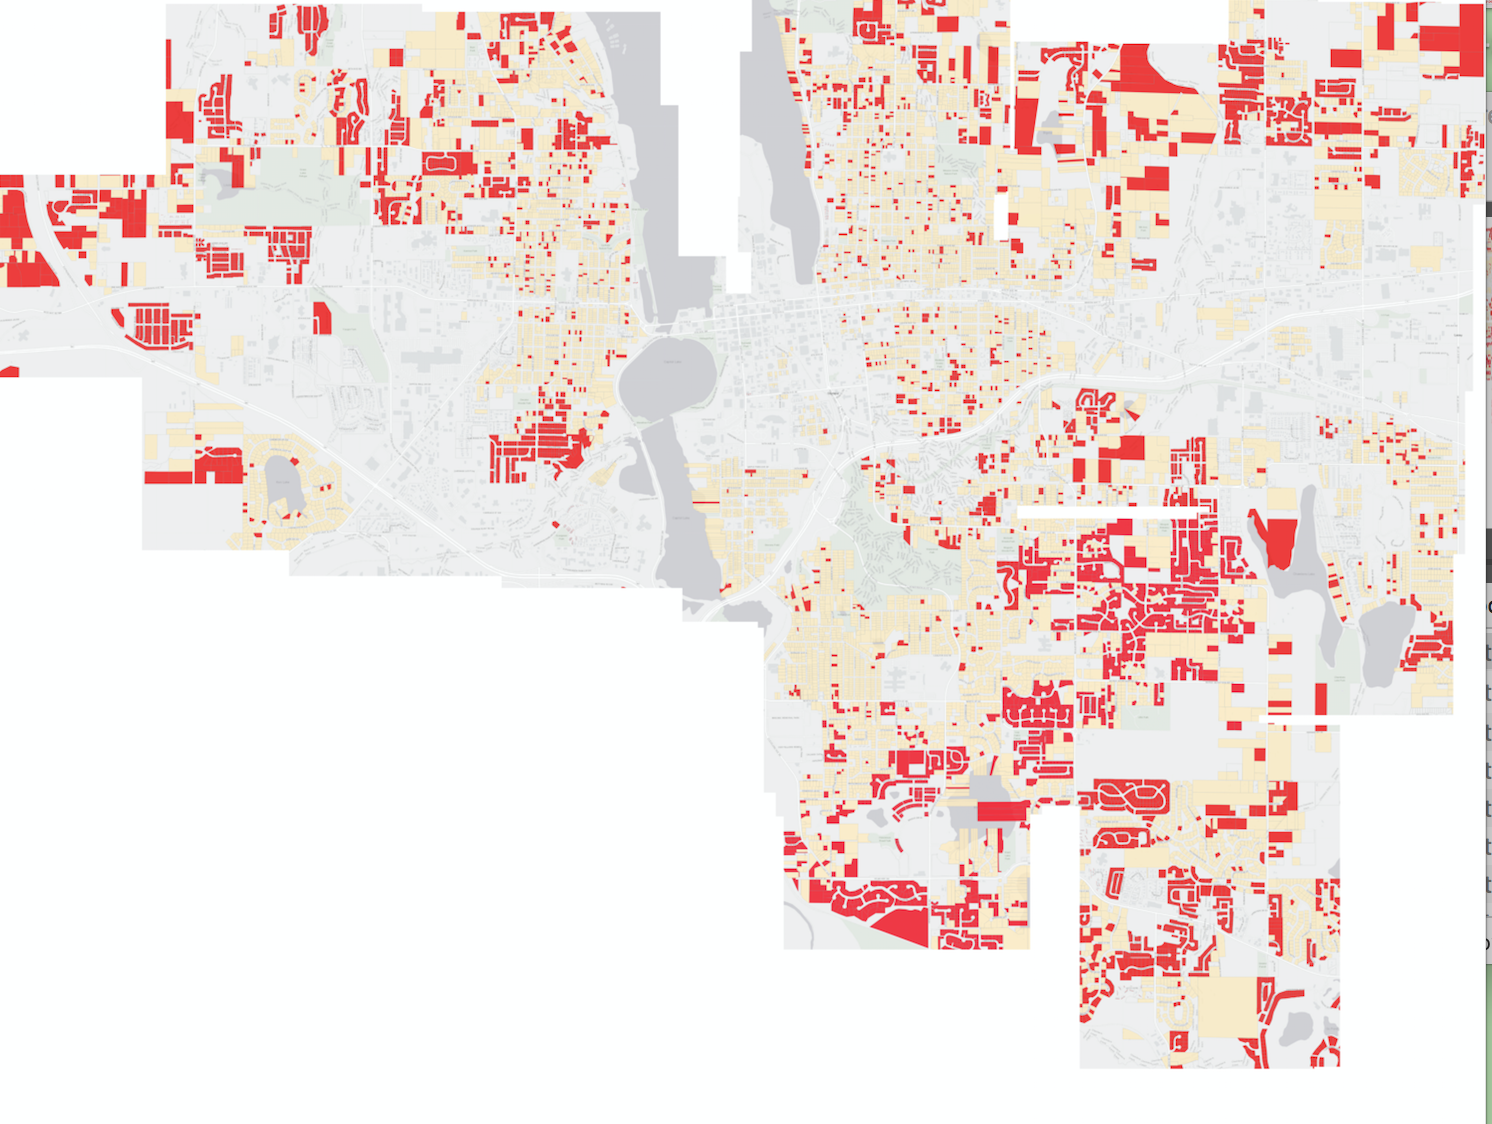
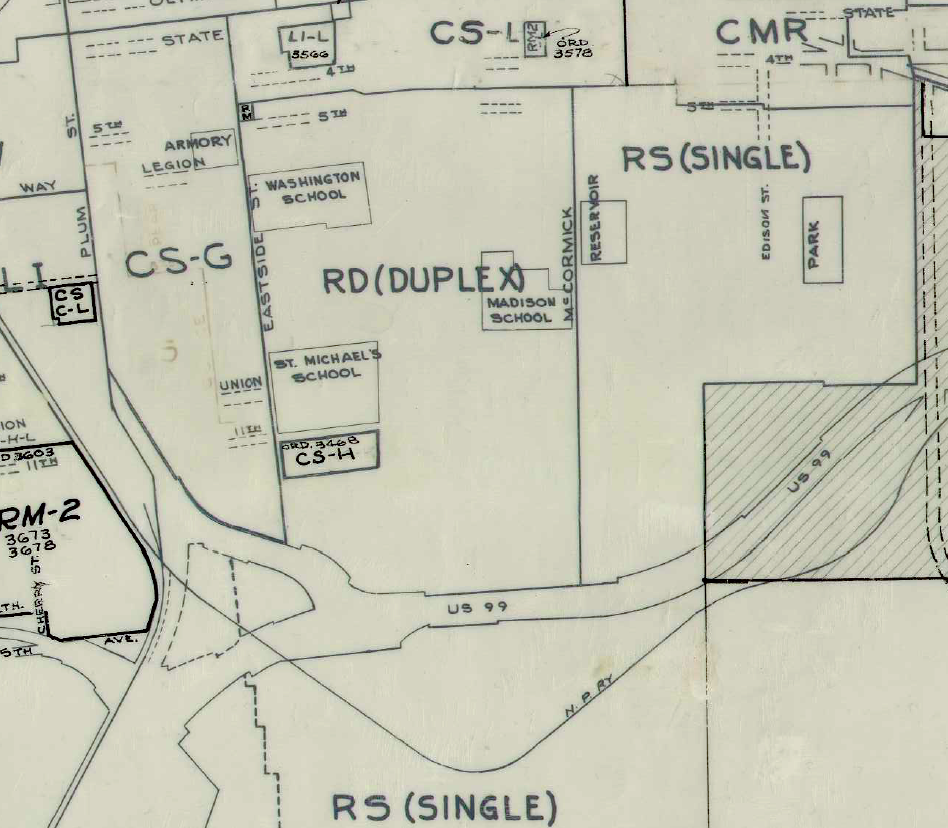
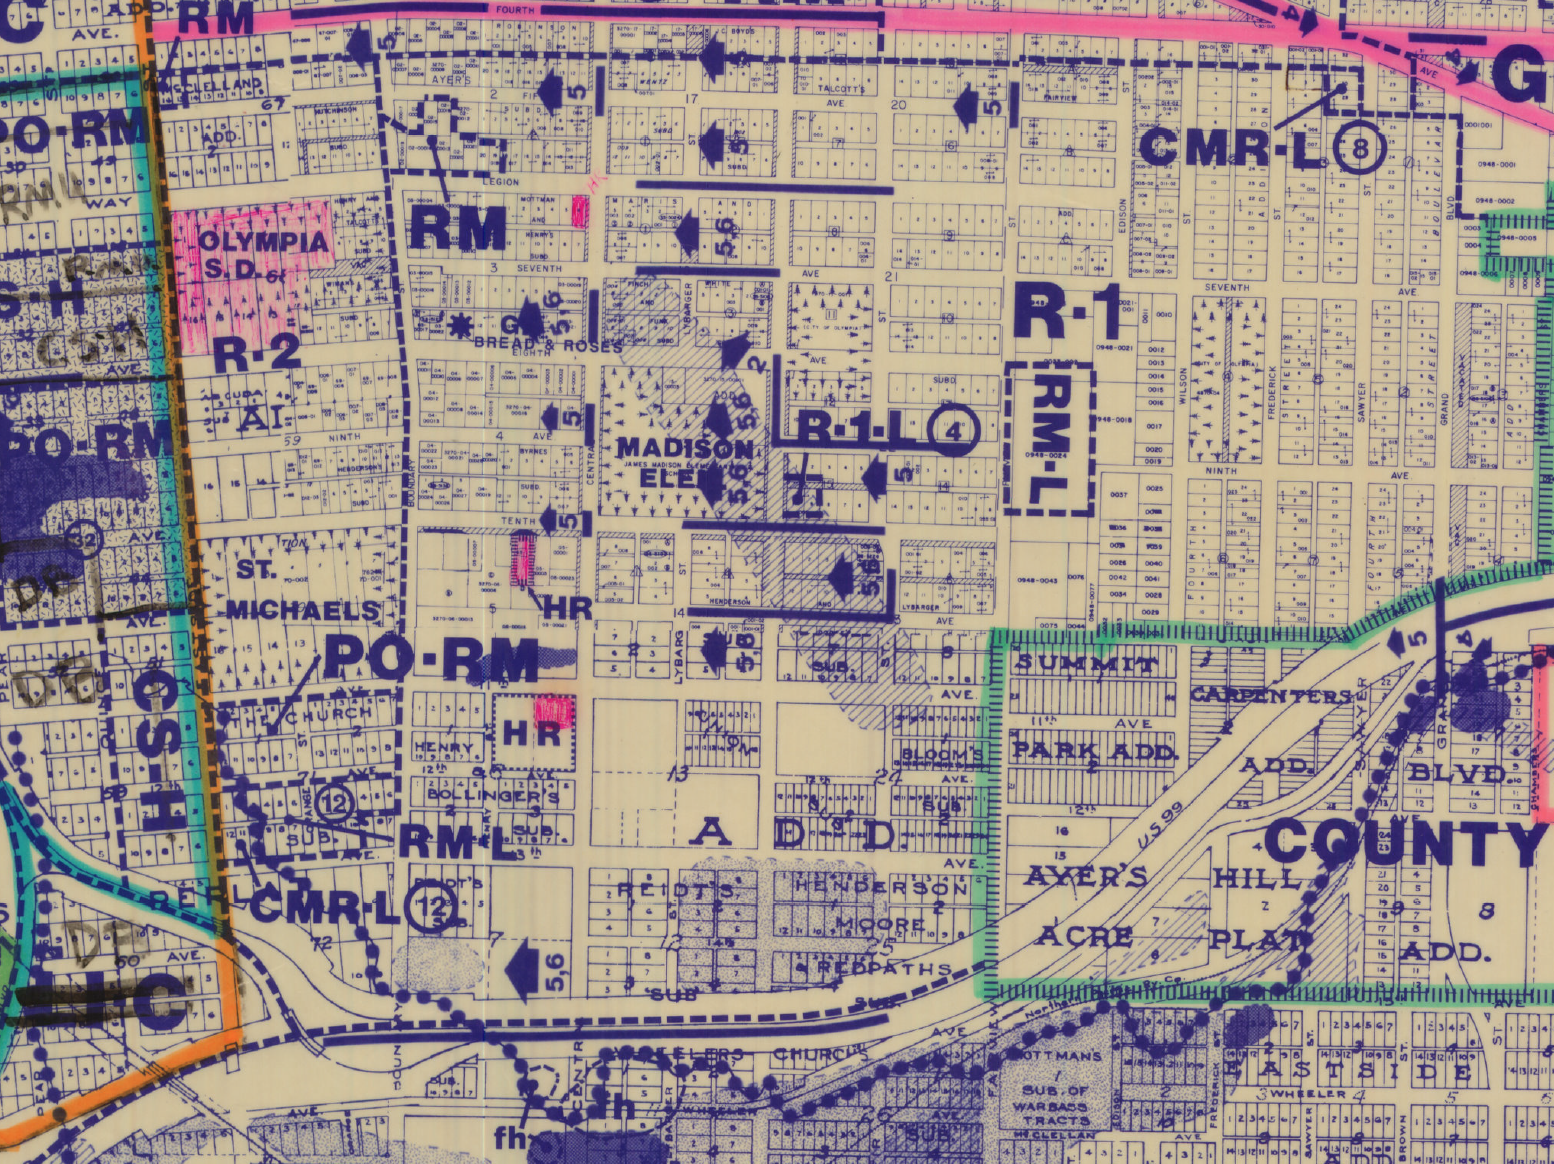
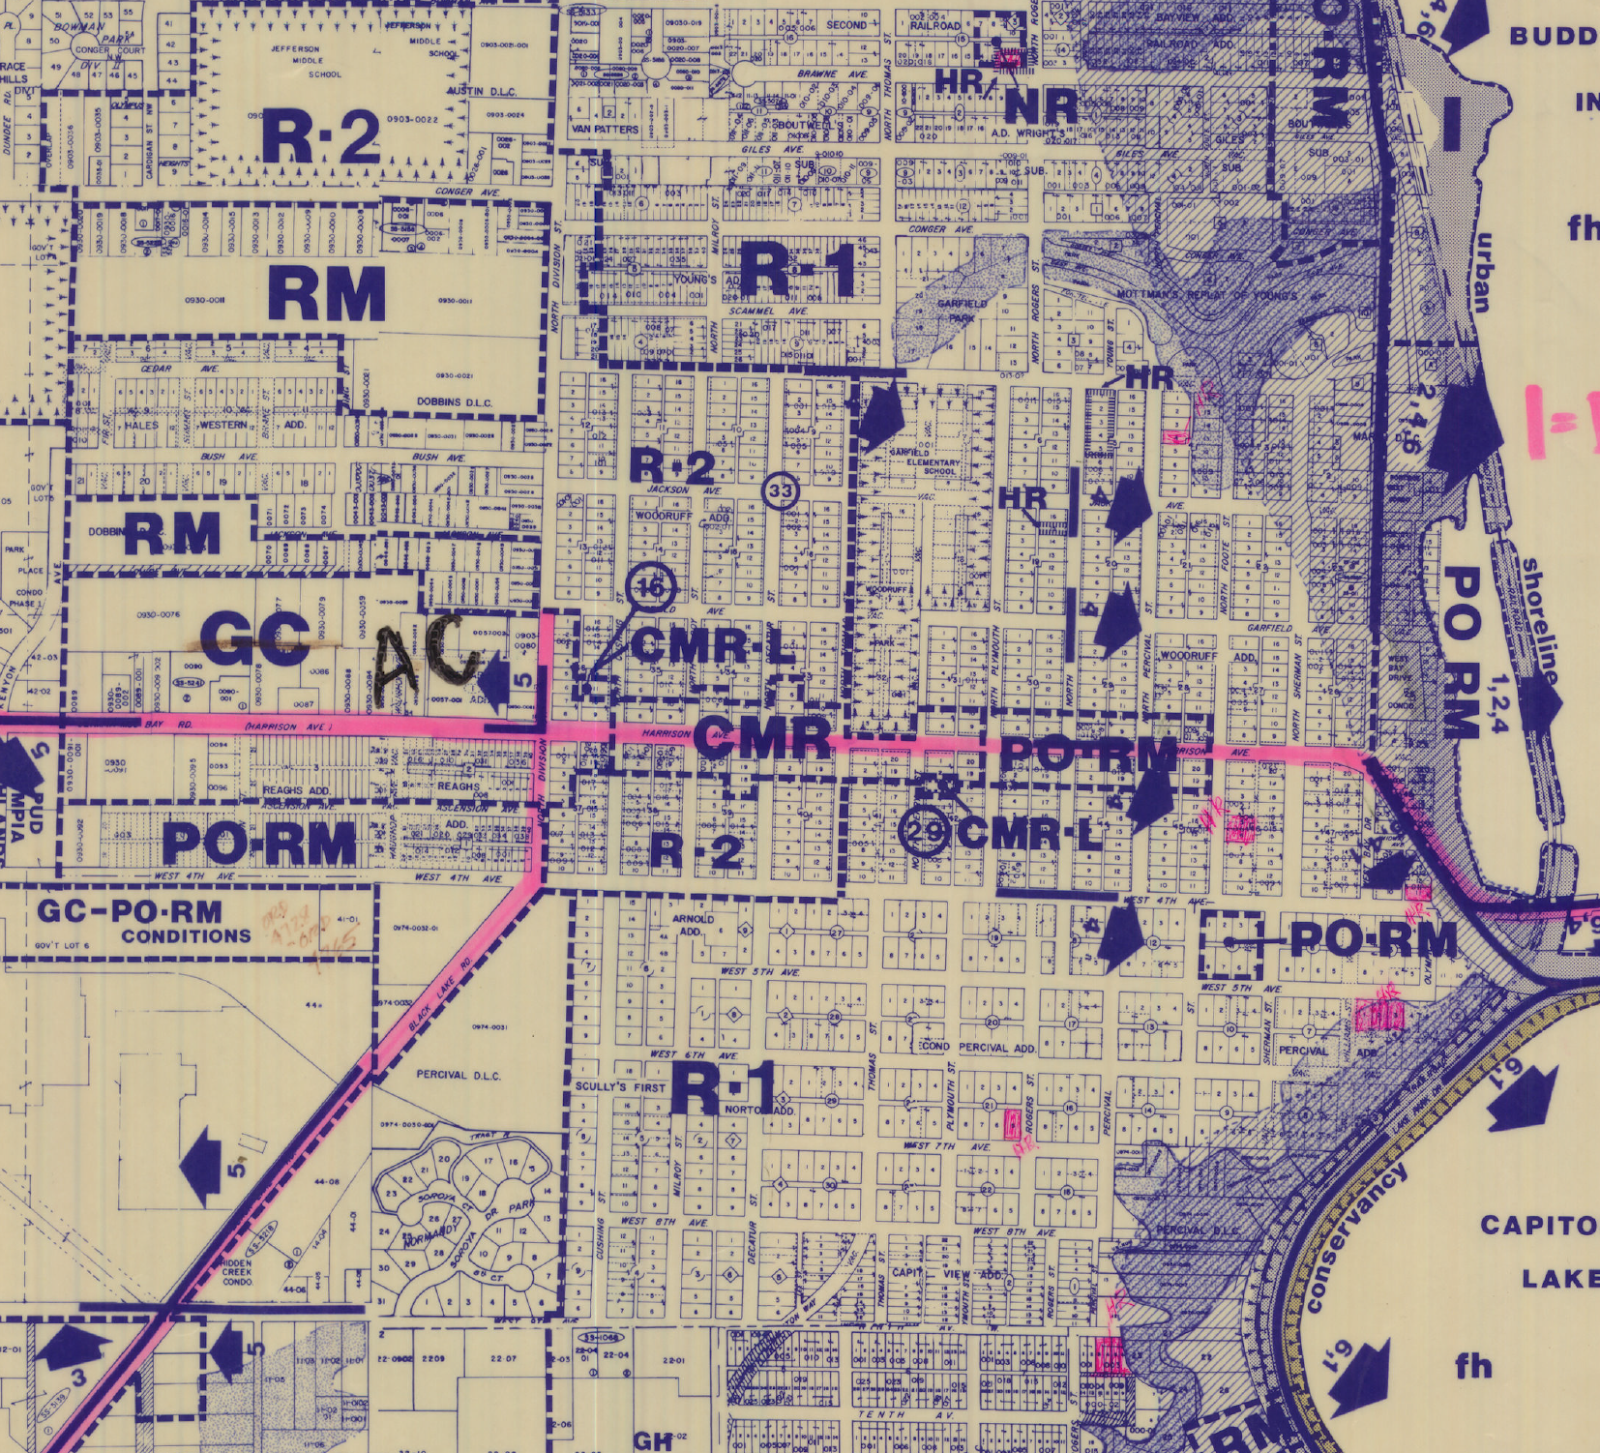
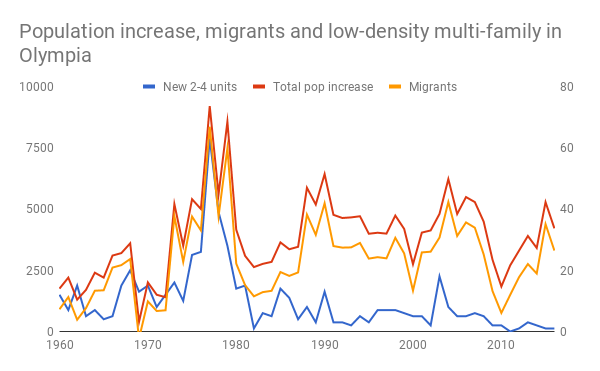
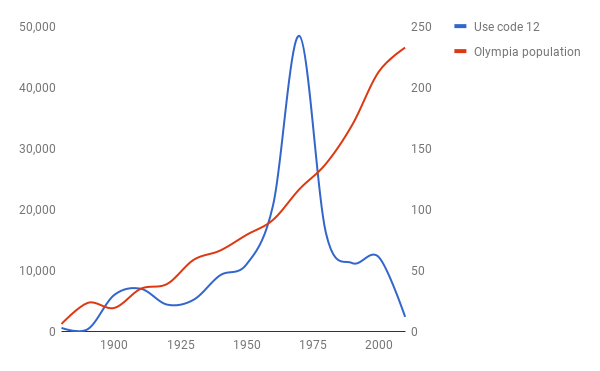
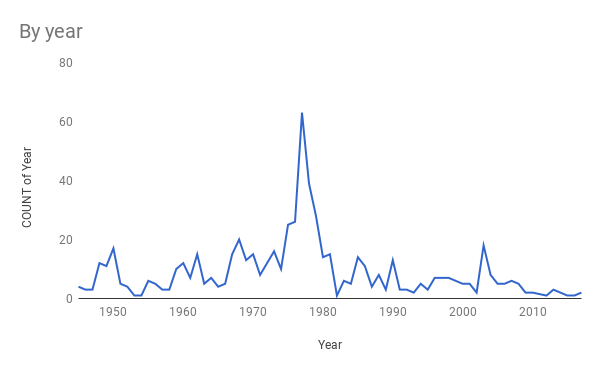
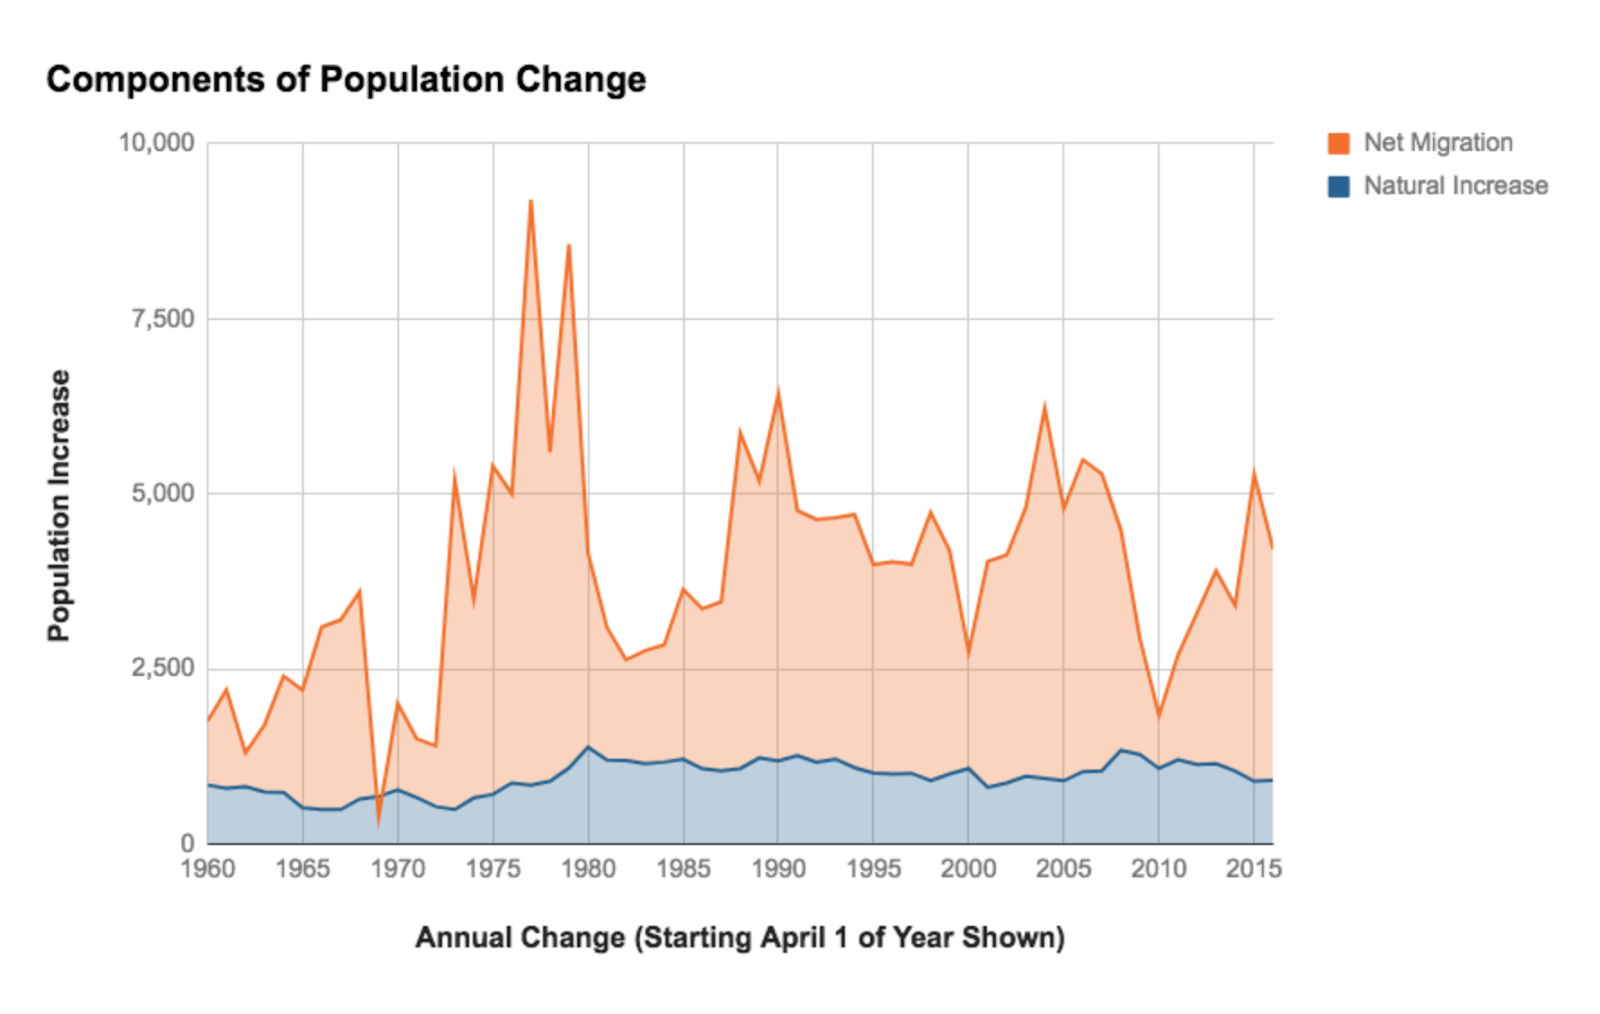
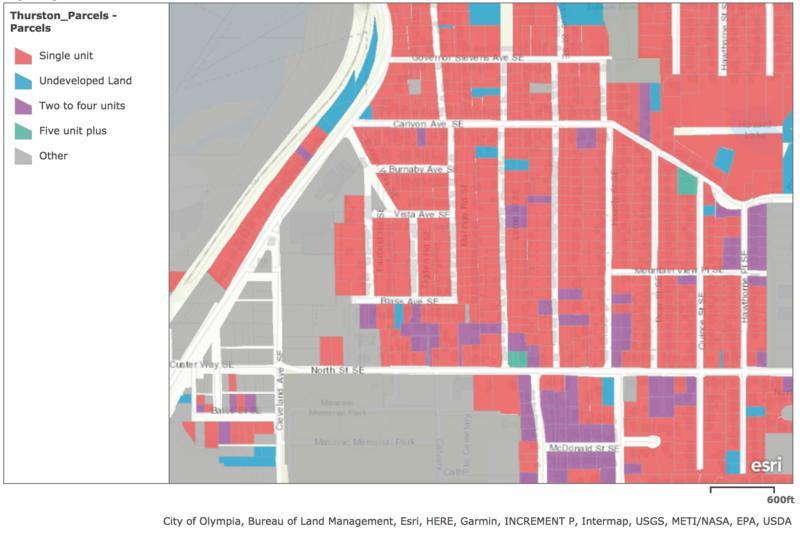
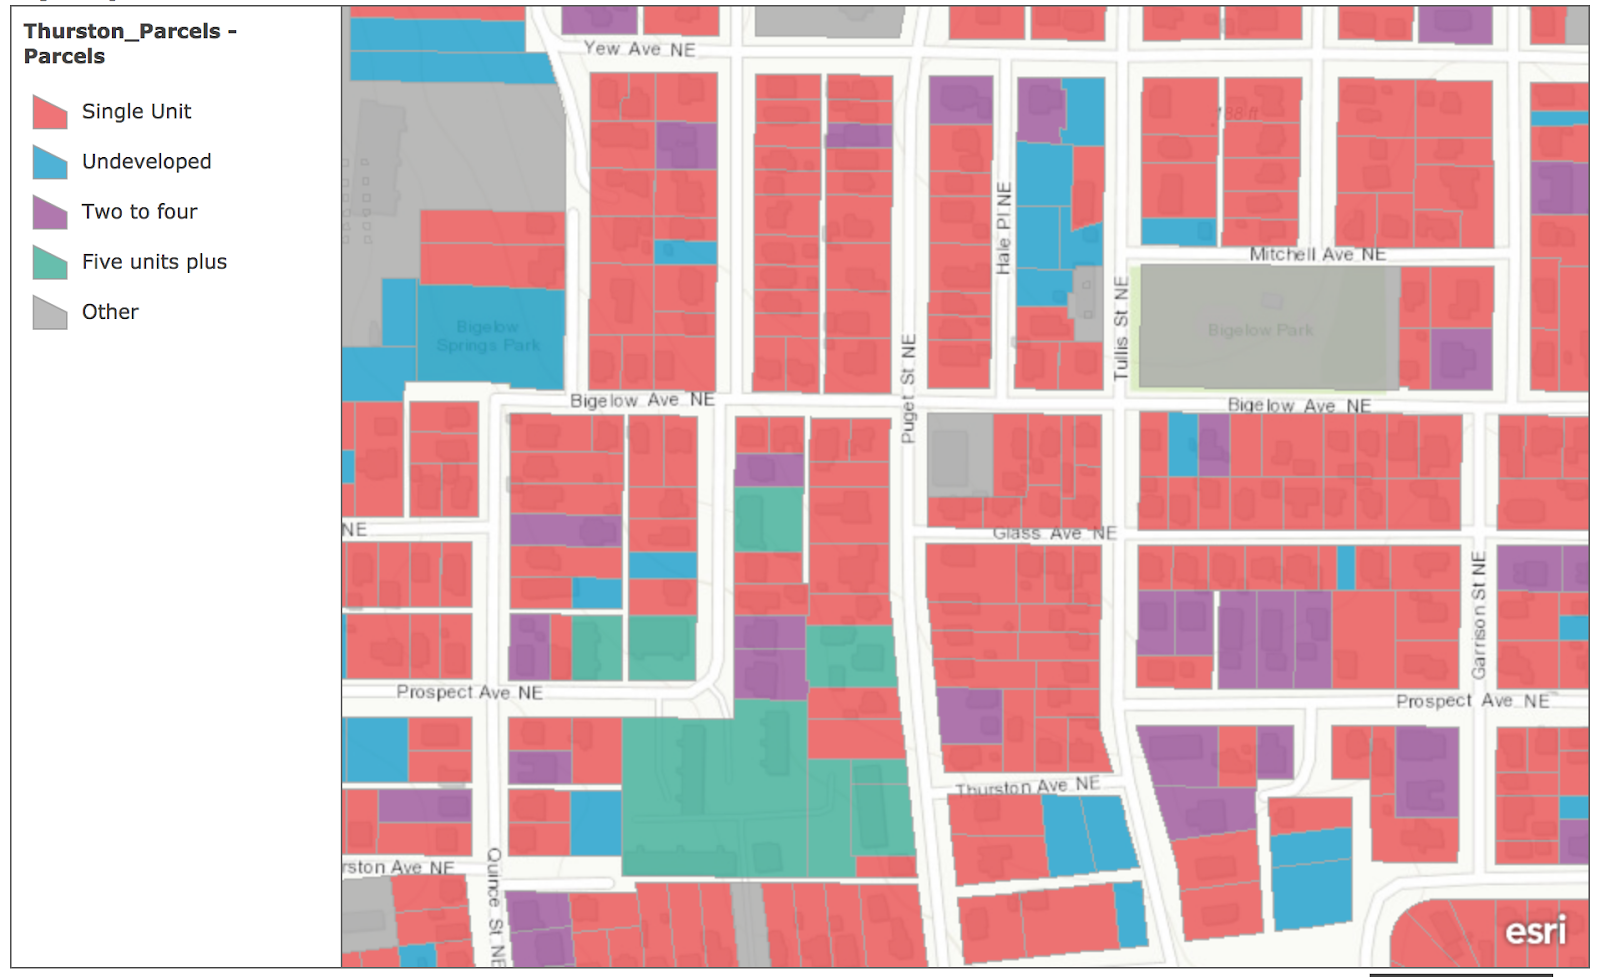
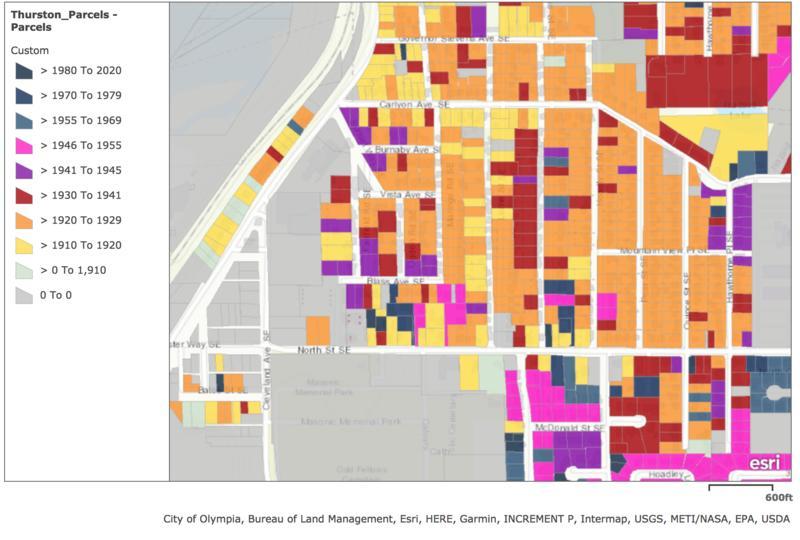
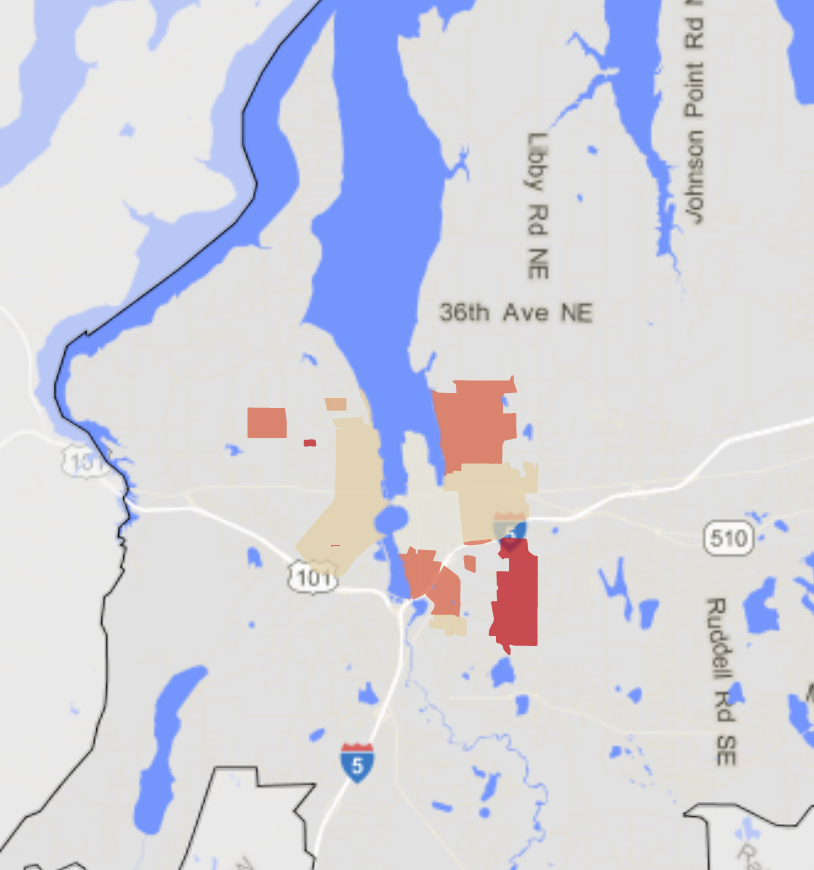
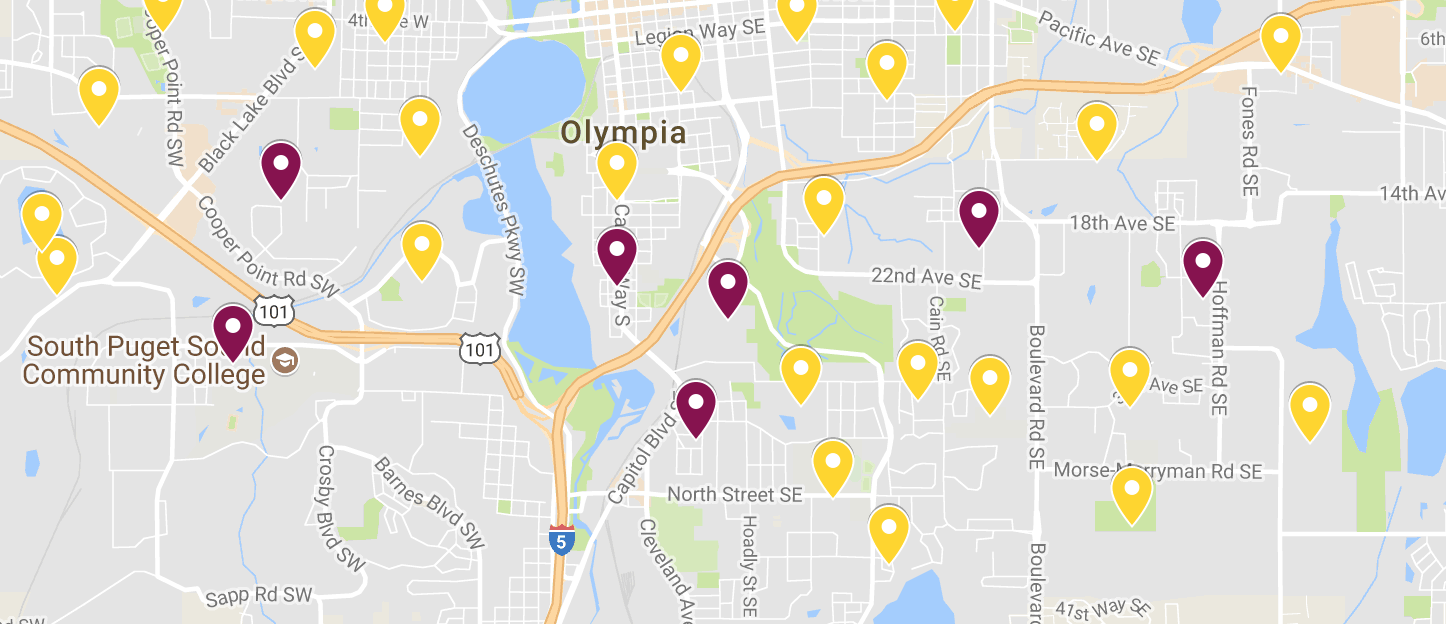
I’ve written about this period of history in Olympia before. First I tracked the sharp decline in small multifamily housing in Olympia since an explosion in the mid-70s. Second, I took a look at zoning maps since the 1960s to the current day and found a declining area that allowed anything but single-family homes. Lastly, I charted the sprawl of single-family homes that resulted since Olympia downzoned.
In this look, I want to explore how we were talking about the change in the city that at one point allowed duplexes and small apartments and then outlawed them.
Beuhler’s proposal set off a series of contentious public meetings where the city planning commission (on which Beuhler inexplicably sat) decided the fate of the Nut Tree quadplexes. Over 500 individual Olympian’s testified to the city planning commission and the city commission itself (Olympia was not yet governed by a city council).
Times were tense when the city commission finally took up the Nut Tree fourplexes. When one city commissioner pointed out that in the late 70s incomes were not increasing at the same rate as the price of a single-family home and therefore it made sense to allow for denser, more affordable options in new construction, an audience member shouted: “Why don’t you move to New York?”
New York in the 1970s not necessarily being an example of a humming urban community. This fear of the urban, the denser and poorer community coming into newer single-family neighborhoods underlined the public debate around Nut Tree. While most of the top-line conversation was simply about the power of zoning and the expectations of homeowners that their newer neighbors would have the same zoning, when you dug down, you go the fear of the urban.
Facing that level of fire over one development was not something the city commission had experienced before, and they quickly put the Nut Tree quadplexes on the shelf.
After Nut Tree Loop, the city took a step back and began to examine multifamily housing across the city. The Citizen’s Multi-Family Housing Taskforce began meeting in January 1978 and worked throughout the spring and summer to deliver a zoning package to the city council.
But, like Nut Tree along 22nd, this proposal met with fierce opposition across the city.
As the city considered a plan that would expand multifamily housing throughout the city (even further than the citizen’s taskforce had intended), an unsigned editorial in the Olympian captured the mood of those opposed to denser housing: It isn’t our job to look after anyone but families and experts that disagree with us are bad.
Those who participated in seven months of hearings by the task force evidently want nothing of the philosophy that holds a community responsible for providing the kinds mixed housing needed by today’s mixed lifestyles — the singles, the elderly and the divorced for instance.
The planners are coming at the problem as theoreticians, as we see it, and they’re not handling the grassroots thinking very well at all… The latest effort to insert recommendations into a citizens report had too much of the smell of “we know what’s best for you” thinking about it.
The commission approved plans that would, on the one hand, allow multi-family housing, but, on the other, only after it was approved on a case-by-case basis. Even then, the economic class of the folks sitting on the Task Force was brought up.
From the city commission minutes in August 1978:
Paul Sparks said his concern is that we would be isolating the lower income families to certain areas away from services and from the city center. The people who are most affected by (the multi-family plan) were not involved on the Task Force.
Two unidentified women then entered into a heated discussion about the makeup of the Task Force, one asking how come low income people had not been considered and involved; the other replying the Planning Commission has asked for volunteers to serve on the Task Force and all this was in the papers and the radio.
The city commission passed a version of the Task Force recommendations, but they failed to turn on the spigot of multi-family housing.
By 1980, the planning commission had again passed a package that would expand multi-family housing across the city. The idea would have been in the early 80s to allow multifamily housing in all areas of Olympia, essentially banning single-family zoning.
And, again the residents of single-family neighborhoods stood up.
Multi-family housing in otherwise single-family neighborhoods will foster “the diverse kind of community that makes this community interesting and makes it rich,” (Raven Lidman) said.
She said when it comes to the good points of living in single-family neighborhoods, “tenants have those same desires.”
But Virginia Baxter, speaking after Lidman, said “The existing inviting neighborhoods will be destroyed, and there will be an exodus of homeowners” if multi-family housing comes to neighborhoods.
…
But Susan Hirst, protesting the proposal, said that multi-family renters will not gain much by being located inside single-family neighborhoods.
They will still be living in apartments, she said, and “you will simply be placing them into a neighborhood where other people have” the style of life the renters want.
But you have to look no further than Bill Grout to find the dark corner of the urbanism discussion in 1980 Olympia. In one article on the 1980 multi-family plan:
“You have increased police activity, increased crime, increased vandalism,” with multi-family housing, said Bill Grout.
Later that summer, as the city commission itself considered the plan, Grout crossed swords with a county leader in a discussion that might as well come out of our current conversation about Missing Middle housing:
Bill Grout, who said he represents Olympia’s homeowners, labeled the proposal one which “would turn Olympia into a ghetto.”
…
(County Commissioner George Barner) said the measure would build up the dwindling rental housing market and would enable low income and young persons to afford a place to live.
He said such housing should be encouraged in the urban areas because most conveniences are located there. He added it would also prevent urban housing sprawl.
Grout contradicted Barner, saying out that multi-family housing would drive down property values in single-family residential areas because renters generally do not take care of their property.
And, so the city turned the proposal down. Not actually turned it down, but rather just put it back on the shelf. A year later the city would approve a townhome ordinance that would allow a certain kind of multifamily housing throughout the city, though one that seemingly favored homeowners.
But, the time of multi-family housing tracking with population increase was over. Olympia would go through several incremental downzones to tighten up single-family zoning areas through the 80s and 90s