History, politics, people of Oly WA

Category: Thurston County (Page 1 of 16)

Annexing the Future

For the first time in over fifty years, more people in Thurston County live inside a city than outside one. It could be an urbanist success story, zoning reform finally winning out, transit investment tipping the scale toward density. It isn’t. The real story’s older, weirder, and a lot less democratic. Once you see how it happened, I think it’s still worth calling out the right outcome.

This is the post I’m writing about the 2026 release of population estimates by OFM. Every year, the agency releases estimates as a guide for state spending. These estimates also give a picture of the changing shape of our communities.
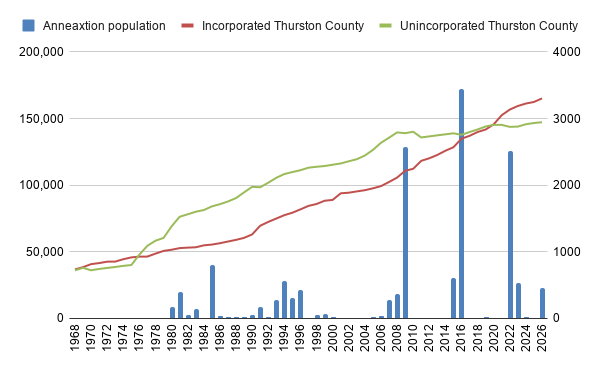
You can see the lines cross in the 1970s and in 2020. The blue bars are the population captured by annexation, and is on the right hand axis, not the left.

This year’s data shows that between 1976 and 2020, unincorporated Thurston County outnumbered the incorporated cities every single year, a run that held for four and a half decades before it broke in the space of six. The trend started in 1976 because the late 70s saw two record years (in both percentage and raw numbers) of massive in-migration, most of which apparently ended up outside the cities.

But, that trend has finally started to shift But, if this were really about people choosing city life, you’d expect a gradual climb, year over year. Folks being priced out of car dependence drifting toward Olympia, Lacey, and Tumwater one household at a time. That’s not what the numbers show. Instead you get a flat unincorporated population since 2008, a 5,000-person drop in one bizarre year, and then a string of specific years where the incorporated population jumps by two or three thousand people all at once. 2009. 2016. 2022.

Those aren’t migrations, they’re annexations.

Before 2009, annexation in Thurston County was small and constant. Cities picked up a parcel here and a parcel there, mostly empty land, occasionally a few dozen or a few hundred people riding along with it. Lacey, Olympia, Tumwater, and Yelm all added pieces most years, rarely anything anyone would call a headline. Lacey’s 1985 annexation brought in nearly 800 residents. Olympia added just over 180 in 1995. These were rounding errors against the county’s total population, just the ordinary housekeeping of city boundaries.
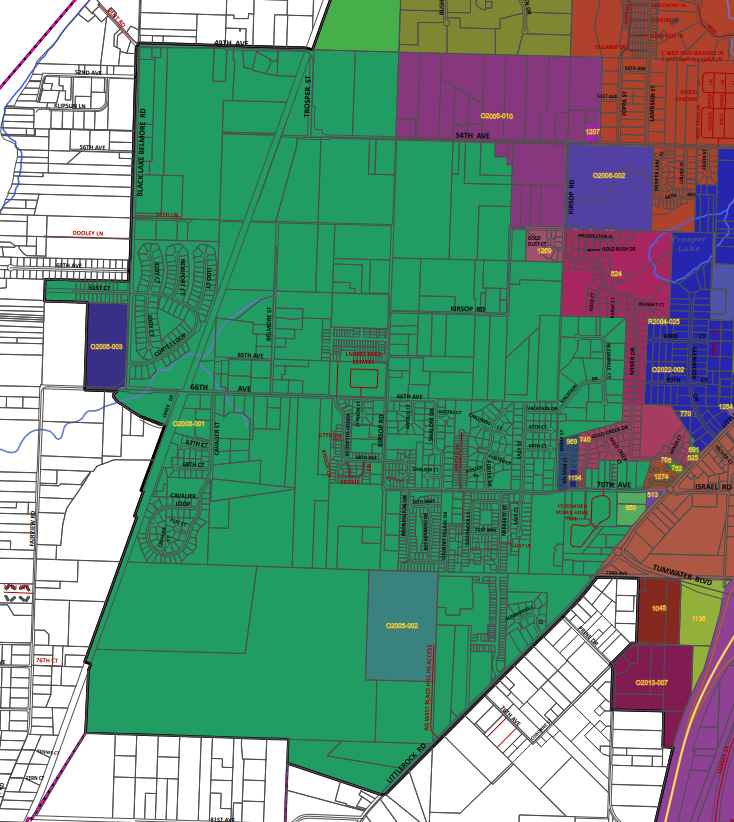
Then the housekeeping stopped and the big grabs started. Tumwater’s annexation, effective February 2008, brought in 2,553 residents in one motion. We’re going to focus on this particular annexation. In my memory, it felt like an existential change for Tumwater, we expected at the time a massive shift in population, that may have happened slower than we expected, given the housing crash a few years later.

Olympia added 562 people in June 2014, a smaller jump but still a departure for a city that usually moved in small numbers. Tumwater came back in January 2016 with the largest single annexation of the last fifteen years, 3,255 residents absorbed in one stroke. Lacey had its turn in 2021, running two separate annexations between May and September that added 1,535 and 978 residents, over 2,500 combined in a single year. Tumwater kept at it into 2022, a dozen smaller annexations in May plus a 332-resident addition in June, while Lacey added close to 100 more that spring. Lacey’s doing it again, with a March 2025 annexation projected to add 455 residents.

Cities were working through a handful of legal tools, deciding case by case and year by year when to catch up with development that had already happened around them. You see a pattern that has nothing to do with a slow cultural shift toward city living.

The old way: leverage, not consent

For most of Thurston County’s modern annexation history, the tool of choice was the Sixty Percent Petition Method. It let property owners representing 60 percent of a target area’s assessed value petition their way into a city on their own. Notice what’s doing the work in that sentence. Not 60 percent of residents. Sixty percent of assessed value. A handful of large landowners, sometimes just one or two big parcels, could decide the governmental future of everyone else living on that land, tenants included.

Where the petition method wasn’t quite enough on its own, cities reached for something even quieter: the “no-protest” utility agreement. Sign one of these to get city water or sewer, and you’d also signed away your right to fight annexation whenever the city decided to come collect.

This is coercive by design, and the state’s own Supreme Court flinched at it once. In 2002, Grant County Fire Protection District No. 5 v. City of Moses Lake found that bypassing a general vote of residents violated the state constitution. For a minute, it looked like the petition method might be finished. The court walked the ruling back not long after, and cities kept using the tool. Tumwater’s biggest annexation wave, the one that added 3,255 residents in a single stroke in 2016, happened well within this post-2002, still-contested legal window.

The fight nobody outside city hall saw

The clearest look at how contested this actually was comes from Tumwater’s 2007 annexation, 1,620 acres that went before the Thurston County Boundary Review Board on a narrow 3-2 vote. The board was one vote from saying no. What flipped it was a last-minute fire service agreement between Tumwater and the Black Lake Fire District, which stood to lose a third of its operating budget once the annexed area stopped paying into it. One dissenting board member called the deal a “shotgun marriage.” He wasn’t wrong. There are real political realities in swapping land between cities and the county, between special districts and city agencies. But, the decline of a rural special district and agreements based on you getting city water are not bad things.

Why the leverage was still the right call

Here’s where I land, and I think it’s a harder position than just cheering for density. The land inside that 1,620-acre annexation wasn’t all farmland waiting to be paved. It was already suburban, already built at a density and a distance from city boundaries  that made a rural fire district and a county road department a worse fit for it than a city government with sewer lines already running past the property. The petition method and the utility agreements were ugly tools, built to let city and landowners jump the line without asking anyone’s permission. But the outcome they produced, in this case, matched governance to a landscape that had already been built. That’s not nothing. A fire district’s claim to keep serving an area doesn’t automatically outrank the question of who can actually do the job better once that area looks and functions like a city. If a city can run water, sewer, fire protection, and roads to a piece of land more efficiently than the county patchwork that grew up around it by accident, the district losing its slice of that territory isn’t an injustice. It’s a service boundary catching up to reality a few decades late.

That’s a different claim than “annexation is democratic,” which it mostly wasn’t. It’s a claim that the state spent thirty years building an escape hatch, that city services should follow city-level density, and that the escape hatch got used, however roughly, to reach that outcome.

The state noticed too

The more interesting shift, and the one I think will matter more going forward, is that leverage isn’t the only tool anymore. After 2002, the state built the Alternative Petition Method, which requires signatures from a majority of both property owners and registered voters, a real check the old method never had. Then came the Interlocal Agreement pathways, letting cities negotiate directly with counties over revenue sharing and infrastructure before annexing anything. In 2023 the legislature revived a sales tax credit specifically to pay cities for absorbing unincorporated growth areas over 2,000 people. 

Boundary Review Boards are disappearing too. Spokane disbanded its board in 2012. Lewis County did the same as recently as 2026. The fights those boards used to referee are increasingly handled through negotiation instead of a contested vote.

Right around the time the old, coercive tools had already finished most of the job, the state built better ones.

What I can’t prove yet

I’d like to end this by telling you that all of this points toward a walkable, mixed-use future for Thurston County’s cities, third places and multimodal streets slowly replacing the cul-de-sacs that got annexed. 

I can’t actually back that up. 

Annexation moves a jurisdictional line, nothing else. It doesn’t retrofit a sidewalk or rezone a strip mall. Everything in this record shows governance catching up to sprawl, not sprawl getting undone. The most honest thing I can say is that Thurston County’s cities now have the tools, and increasingly the financial incentive, to govern the suburban land they’ve absorbed. What they choose to do with that authority, whether it produces the kind of denser, more human-scaled development that we  want, is still an open question. That part is hope, not history.
Smith Troy, Trump and Telling the Truth

We’ve all heard President Donald Trump call the press “the enemy of the people.” Over the course of his terms, he repeatedly attacked news organizations as “fake,” “corrupt,” and even suggested some were engaged in illegal activity.

Beyond insults, he openly questioned the constitutional protections that shield journalists, including the landmark New York Times v. Sullivan precedent, and proposed “opening up our libel laws” so politicians could sue and “win lots of money.”

His rhetoric and actions exemplify a long-standing tension in American democracy: the fragile balance between government power and press freedom. Yet this struggle is far from new, and it is not new here at home. Nearly a century ago, in Thurston County, local politics intersected with criminal libel laws in a way that foreshadows today’s conflicts.

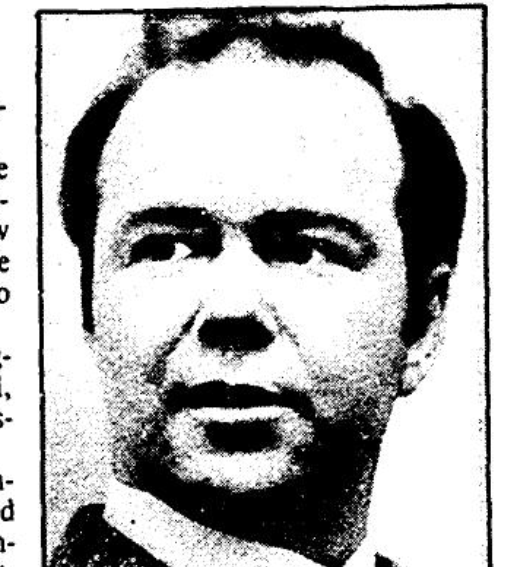
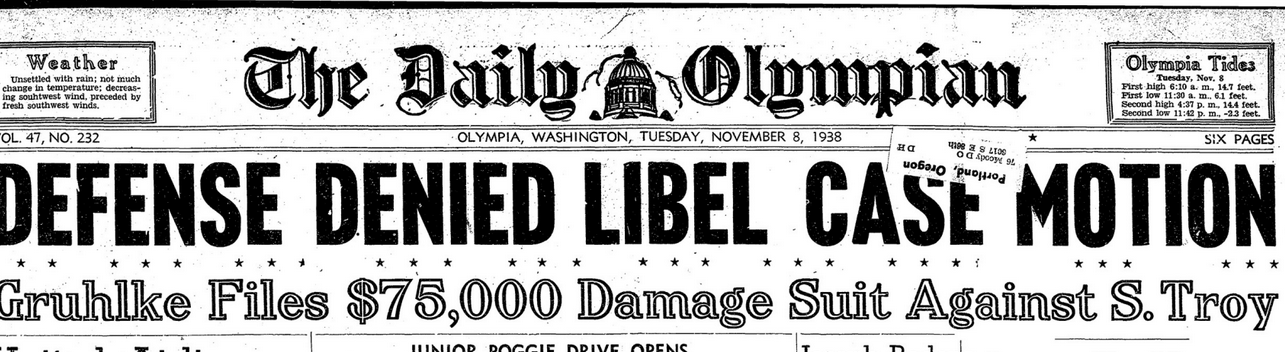
The story begins in November 1938, when Thurston County Prosecuting Attorney Smith Troy filed criminal charges against three men: Ray Gruhlke, Lester Main, and George Johnson. He accused the defendants of distributing handbills that allegedly defamed Troy and his brother Harold, who was an assistant county prosecutor. The charges contended that the statements were malicious and intended to expose the Troys to “hatred, contempt, ridicule, and obloquy,” depriving them of public confidence, consistent with the criminal libel statutes of the time.

Almost immediately, questions arose about the integrity and motives of the public officials involved. The circumstances of the arrests suggested potential overreach, and critics argued that the case may have been politically motivated to protect the interests of Smith Troy while undermining his opponents. Affidavits from law enforcement contained conflicting accounts of the arrests, raising doubts about the accuracy and impartiality of the official record. The court initially denied motions to appoint independent attorneys to investigate the charges, further highlighting the potential for bias. The case only began to take a more credible direction once a Special Deputy Prosecuting Attorney, Harry Ellsworth Foster, was appointed to replace Smith Troy, whose personal involvement as the alleged victim created an obvious conflict of interest.

Over the next several months, the Special Prosecutor’s investigation revealed that the alleged libel stemmed largely from confusion over incomplete court records. The handbills pointed to cases that the Troys were apparently prosecuting improperly, but the cases referenced in the pamphlets had been transferred, and the inconsistencies were clerical rather than malicious.

The defendants admitted their errors, tendered apologies, and Troy accepted them. By May 27, 1939, the court dismissed the case, noting that the controversy had prompted reforms to ensure future records were clearer and less prone to misinterpretation.

The Thurston County case cannot be fully understood without situating it within the broader legal context. Smith Troy would not have been able to pursue charges without statutes defining libel broadly as any malicious publication exposing living or deceased persons to hatred or contempt, or injuring any person in business or occupation. A person could be prosecuted even if the statements were true, unless published with “good motives” and “for justifiable ends.”

By the 1930s, criminal libel prosecutions had become rare, yet the statutes remained on the books through 2009, offering public officials like Troy a tool—however rarely used, to protect reputations through criminal law.

The law’s overreach and constitutional vulnerabilities became clear in 2008, when the Washington Court of Appeals struck down the criminal libel statute as facially unconstitutional. The court held that it violated the First Amendment because it punished false statements without requiring proof of actual malice and, paradoxically, could punish true statements lacking “good motives.” The legislature formally repealed the law in 2009. Modern statutes surrounding protection orders have partially revived criminalized libel in limited circumstances, primarily to address harassment and repeated false statements made with malice.

The Smith Troy case illustrates how criminal libel statutes historically empowered officials to suppress criticism, a temptation not lost on modern politicians. Trump’s attacks on the press echo the same impulse: using legal threats, regulatory power, and public shaming to undermine journalists and chill reporting. Unlike Thurston County in 1938, Trump operates on a national stage, with the ability to influence federal agencies, control access to government events, and challenge the judiciary’s interpretation of defamation law.

Yet the comparison also highlights both the fragility and resilience of press freedom. In Thurston County, the appointment of an unbiased Special Prosecutor and the eventual dismissal showed that legal checks, due process, and transparency can constrain abuses of power. Today, protections like New York Times v. Sullivan perform a similar role, ensuring that even powerful political actors cannot easily weaponize libel law against the press. Without these safeguards, the line between legitimate critique and suppression of dissent blurs, leaving citizens less informed and democracy weaker.

The trajectory from Smith Troy to Trump underscores that the press is both a target and a guardian in any democracy. Laws may criminalize speech, but misuse or selective enforcement erodes trust in both institutions and government itself. Meanwhile, as local news declines and national outlets consolidate, the onus falls more heavily on government to act transparently. A free press alone cannot ensure accountability; officials must make accurate information accessible, clear, and timely, or risk leaving the public in the dark.

History reminds us that power will always test the boundaries of scrutiny. The Thurston County libel case offers a microcosmic lesson: fair process, independent oversight, and transparent government are essential to maintaining the balance between authority and the public’s right to know. Today, as political leaders attack media and propose changes to defamation law, the stakes have moved from local to national. The core principle remains unchanged: the press must remain free to speak, investigate, and hold power accountable, and government must meet its own obligation to be transparent in a media environment that can no longer do it alone.

Will Thurston County deaths outstrip births again?

Last year’s population estimates were historic in Thurston County, for at least one reason: for the first time since records have been kept, the number of annual births were outpaced by deaths. The county still saw a population increase because of in-migration. But, even those numbers were relatively flat, keeping with a recent trend of steady (if historically median) in-migration. Since the historic in-migration in Thurston County in the 1970s, the number of people moving here has bounced between 2,000 and 5,000 people each year, despite the increase overall in population.

The data below is based on last year’s population data release from the state.

In regard to how we got to a negative natural population increase, it looks like a combination of a flat birth rate since the recession and a rapid increase in deaths in the last few years. I’m not an epidemiologist, but it seems likely that the natural decrease is probably a combination of the impacts of generational population change (baby boomers getting older), obviously Covid and a flat birth rate.

One thing I’ll definitely want to do with the chart above is change it from raw population data to growth by year as a percentage to give a clearer trend from the 1970’s massive growth to today.

But now let’s look at the historic battle between birth and death:

Underlying data on births v. deaths in Thurston County

Source: Populations estimates (OFM)

While the gap in deaths vs. births was tightening in recent years, mostly because of the flat birth rate, the pandemic spiked deaths in Thurston County, driving the total number of deaths above births.

But, well we zoom out, we see that Thurston County is not alone in losing the battle with death.

Thurston County’s situation seems to be part of a statewide trend across all counties starting a decade or so back. Here are all natural change totals as a percentage of population, colored for increase (blue) or decrease (red):

Underlying data on county level natural population change.

Source: Components of population change (OFM)

Generally speaking, Washington counties had healthy natural population increases until the mid to late 1980s, and then they began sliding downward.

There seems to be a fascinating correlation in this particular data that deserves more exploration. The leading counties in this trend seem to follow a particular model. The counties that led the trend in this decline fall into two general groups: Pacific, Wahkiakum, Clallam, and Jefferson (declining Olympic Peninsula timber counties) and Garfield and Columbia (tiny upper Snake farming communities).

Re-examining the out-of-town (or just corporate) real estate investment in Thurston County

Back in July 2021, I took a deep dive into the number of houses that were owned by corporate out-of-town investors. What I found then was the scale of investment was within the bandwidth of what could be expected.

It turns out I chose about the least opportune time to take a snapshot of corporations buying single-family homes. I didn’t track it at the time, but 2021 and 2022 were the largest years for this kind of transaction in the records I found. My first look was just a bit too early to catch it.

In this analysis, I will take a look at the four largest corporate owners of single family homes in Thurston County. I’ve been trying hard for months to finish this post, so the data I used is a few months out of date (January 2024). I assume nothing major has happened since then.

Counterintuitively, two of the four corporations are headquartered here in Thurston County: Rob Rice Homes and Walter Cox Company. The other two are out-of-town corporations, Invitation Homes (from Dallas) and Home Partners (Chicago). That said, their portfolios are on a completely different scale.

Prior to 2016, Rob Rice and Walter Cox were pretty much the only institutional buyers in Thurston County. Home Partners began to purchase in 2016 and then really took off in 2021. Invitation Homes not only appeared on the scene in 2022, but dominated the market, changing the scale altogether. Their 121 homes purchased just in 2022 was just a couple dozen shy of all the homes purchased by the top four since 1995.

It is worth noting that while Invitation dominated, Walter Cox (headquartered in Lacey) also bought more homes in 2022 than they had in any other year.

Comparing these purchases of the top four across the entire housing transactions in the county, you see the percentage go from barely perceptible to actually measurable (above 3 percent of all transactions) in 2022.

What is interesting is 2022 was not necessarily a banner year in home sales in Thurston County. The year prior was the all-time peak, with 2022 representing a cyclical slide down. These purchases also came at a time when mortgage rates were sliding up. The average price was also still climbing in 2022. These three combined: total sales sliding down, mortgage costs increasing with the climb in sale prices not abating, seemed to have combined to mean a mixture of circumstances that benefited corporate purchasers.

Despite this, the out-of-town ownership level in Thurston County (not counting our two local owners) is not high compared to the rest of the country. The Owned Away From Home analysis by Regrid:

Let’s talk geography:

Generally speaking, all the top four are clustered towards the edges of the northern Thurston County cities, especially towards southern Lacey and Hawks Prairie. There are some definite clusters:

  • Home Partners and Invitation are pretty typical, but with strong clusters in Hawks Prairie.
  • Almost all of Walter Cox houses are in two or three neighborhoods along College in Lacey.
  • Rob Rice follows a similar pattern, but with a broader reach out towards Tumwater.

Years built

This is interesting, because unlike the hockey stick of the purchase-by-year chart, the homes built-by-year is different. While there is a peak in newer homes by local Rob Rice in 2022 and 2023, most of the homes purchased have an average age of at least 10 years. Meaning, even though they’re newer than the average home in Thurston, they weren’t being bought directly from developers, but by individual sellers.

I’m not sure if I’m ready for a total revamp of my opinion about corporate ownership of single family homes. I feel there’s a bit of classist hand wringing about this phenomenon that doesn’t exist for people living in apartments owned by large out-of-town corporations. Additionally, apartments aren’t for everyone and buying isn’t for everyone. Not everyone lives in a place long enough to make buying a home make a lot of sense. And we shouldn’t relegate those folks to apartment living if they don’t want to. So, the moral framing of corporate ownership of single family homes doesn’t do it for me.

That said, a recent discussion in the Strong Towns community makes an argument that I do find compelling. That this isn’t an issue on a broad countywide or national level, but rather on the neighborhood level. Additionally, it can theoretically be a problem, especially with out-of-town owners causing a decline in the economic fate of a neighborhood. And, we know that corporate ownership in Thurston County is clustered in certain neighborhoods, so it is worth exploring that risk.

Getting back to the Regrid research, they find a correlation between household incomes and out of town ownership. They created a map that compares incomes against out of town ownership. Again, they didn’t measure all corporate ownership, just the ones that weren’t near where they owned homes. In Thurston County, they found one neighborhood in West Olympia that had a high correlation between low incomes and high out-of-town ownership:

What is interesting is that the neighborhoods with high clusters of corporate ownership in Hawks Prairie and south of Yelm Highway in eastern Lacey that aren’t on this map.

What further research I would like to see is taking an even finer comb to the Thurston data and measure parcel-by-parcel in the really high cluster neighborhoods and see what developments have the highest percentage of out of town ownership. Now that I think of it, it woudn’t be that difficult, but it is a measure for another post.

The (mostly) lack of evidence of the impact of race in Badillo-Diiorio/Scott race in for North Thurston Schools

For me, the most interesting election in the county this year was between a candidate for the North Thurston School district and her opponent, who had endorsed here.

In a more perfect world, no one would have voted for Stephanie Scott. She did not campaign and had endorsed Esperanza Badillo-Diiorio weeks before the primary election. But because she endorsed Badillo-Diiorio after the deadline to withdraw, Scott’s name remained on the ballot. And, probably more importantly, her candidate statement remained in the Voters’ Pamphlet.

In one of the oddest possible returns in the primary, Scott even finished ahead of Badillo-Diiorio for a few days as ballots were being counted before the primary was certified, possibly knocking a candidate she supported.

No one’s fault really, that’s just the way elections work. And, Scott did spend a lot of time campaigning for her opponent, so it wasn’t that big a surprise that Badillo-Diiorio will be certified the winner of the general election in a week or so.

But what I was interested in was the phenomena of two candidates with the names Badillo-Diiorio and Scott, where Scott was the candidate not really running.

Matt Barreto wrote an influential paper in 2012 (then a professor at the University of Washington) describing his finding of racism in the Yakima County results in a race between well-funded (and now Supreme Court Justice) Steven Gonzales and un-funded, non campaigning Bruce Danielson. Basically, Barreto compared the results for Danielson by precinct against those of other conservative candidates and found that Danielson would outperform those conservative candidates.

You can read Barreto’s entire study here.

Barreto’s example of an election impacted by racism looks like this:

Using a similar technique, the Badillo-Diiorio/Scott race looks like this:

Instead of using Republican candidates, I used the composite returns of the two non-Democrats (who could be fairly described as conservatives) who ran for countywide offices.

While Danielson outperformed the Republican in 100 percent of precincts, Scott only won 57 precincts compared to 49. Hardly a barn burner.

It is worth noting, that in Barreto’s analysis, he found racism impacting voting in Yakima and Grant counties (on the eastside) but did not find it in Snohomish County. It is very likely that Thurston County is more similar to Snohomish than Yakima or Grant.

What is left unaddressed here or in Barreto’s work, is why anyone would vote for a candidate who is actively not campaigning. Or, more specifically, in Scott’s case, endorsing and campaigning for their opponent.

I’m sure the lack of media coverage in the race had some impact. Most of what voters heard in this race likely came from the Voters’ Pamphlet, which did not provide a lot of difference between the two candidates. That seems to be born out in the results. Compared to the two other North Thurston school races, Badillo-Diiorio/Scott had more undervotes (people not voting at all) and write-ins.

So, in the end, it is likely just voters not entirely sure what to do. The majority of Scott voters likely would have voted for her opponent had they learned she was no longer in the race.

Three ways to think about pedestrian deaths in Thurston County between 2006 and 2020

Somewhere back in the peak of the pandemic, there was a popular Facebook post here in Olympia that I thought was interesting. The post pointed at the signs distributed by Intercity Transit asking people to slow down. The social poster asked why we didn’t have signs asking for people to stop committing other crimes.

The idea was that anti-social behavior, visible homelessness and property crime were much bigger issues in Olympia than speeding and injuries to pedestrians because of speeding. Since then, I’ve been poking around for a way to compare like-for-like, to be able to compare the two sides of the argument, or just to get an idea of the scope of traffic related deaths in Thurston County.

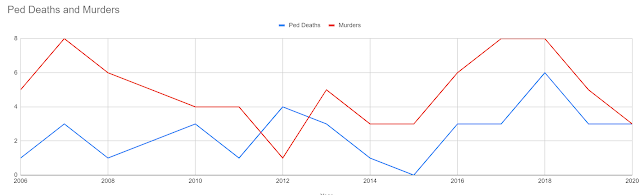
So, I have been playing around with pedestrian death data from the federal Department of Transportation and come up with a few broad conclusions:

  • How being killed by a driver compares to any other homicidal death
  • When you’re more likely to be killed by a car and 
  • (most interesting to me) where you’re more likely to be killed by a car

A note on the data itself: most of this comes from the Fatality Analysis Reporting data from the USDOT. Other data I cobbled together from TRPC, the Thurston County Coroner’s Office and WASPC. It is also worth noting that the FAR data I used only goes through 2020, but 2021 and 2022 saw record pedestrian deaths.

1. Pedestrian deaths and murders are in the same neighborhood

To get to the main premise of the now-lost social post itself, that we should pay closer attention to other crimes and not just pedestrians being killed by cars, I suppose the data carries that point. But when you consider the vast majority of murders (over 90 percent in 2017 for example) were committed by non-strangers, that puts deaths by pedestrians in traffic in another context.

When you kill someone with your car, there are a lot of reasons outside the generalized behavior of drivers and pedestrians. These include bad road design, lack of marked crosswalks, left turns and large, multilane roads.
Bad road design, lack of crosswalks and our dependence on so-called stroads seems to make pedestrian deaths a much bigger part of local government. Obviously, each homicidal (or man-slaughter or non-natural) death is one of importance for public policy. But, I think my reaction to the main premise of the now-lost social media post is that it is at best a wash.

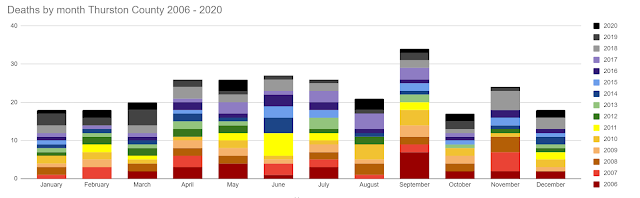
2. September is the deadliest month

What is surprising here is that the winter months are lower altogether than summer months overall. You would imagine that more light would lead to fewer deaths. But, according to research on the temporal nature of pedestrian deaths, there are more car trips in the summer, which lead to more deaths.

3. Downtown Olympia, Old Lacey and Grand Mound

The most interesting part of the traffic data is that you can easily geocode it. Here is a map of all pedestrian deaths in Thurston County.


What you can see are a few clusters of activity:
Old Lacey/East Olympia:
To summarize, Lilly Road north of Martin, Martin Road east of Lilly are both hotspots within the hotspot. But given the reasons for pedestrian deaths cited above, this area seems to be rate fairly high. But it is worth noting that there were more deaths here than in other places with the same characteristics, such as Yelm Highway or Hawks Prairie.
Downtown Olympia:

What is surprising here is that there aren’t more deaths in downtown Olympia. State, Capital Way, Legion and Plum are all different sorts of thoroughfares. But, in terms of pedestrian density and the amount of traffic going through downtown, it could be easily assumed that there would be more here. Possibly, though, the infrastructure here is kinder to pedestrians, making it much more likely that drivers will be cued to notice them or drive slow enough to not kill them in the case of an accident.

Grand Mound:
This was a surprise hot-spot to me. But, I am always surprised by Grand Mound, to be honest. There is a lot going on down there. It was years ago when I noticed that the census tracts that made up Grand Mound had the same population as Tumwater proper (not including the UGA). The kind of rural/not rural development here probably is dense enough to encourage some walking. But also, is low density enough not to encourage slow driving that would prevent pedestrian deaths.

How an incumbent sheriff loses

Sheriffs have incumbency power. A lot of elected officials do, but with the acquittal of Sheriff Ed Troyer in Pierce County last week, it is worth looking into how sheriffs stick around and how some of them lose.

Troyer survived the court case (which would not have kicked him out of office), and will also not likely be subject to a recall effort. Recall elections are expensive and have a hard time getting off the ground. The Pierce County Council, which has officially shown its displeasure with Troyer, cannot fire the Sheriff. So, the next opportunity would be in a couple of years when Troyer heads back to the ballot.

For at least one answer about incumbent sheriffs, I want to go back to two Thurston County Sheriff campaigns, one from the mid-1980s and one from just a few weeks ago.

The call is coming from inside the house

Gary Edwards, 1986

Gary Edwards (who is now a county commissioner) had worked for the Thurston County Sheriffs Department for less than a decade, working his way up to detective by the mid-1980s. The then 39-year-old represented a new generation of law enforcement when he decided to challenge the sitting Sheriff, Dan Montgomery.

Montgomery apparently entered the race a weak leader, as one of the early articles on the race included five declared candidates, all from law enforcement backgrounds and two from other local agencies.

Interestingly, as a fairly high profile sheriff employee, Edwards would normally make the paper a handful of times from the late 70s to the early 80s. But, there were no mentions for a full calendar year until he filed to run in February 1986. Was Montgomery working to silence a potential opponent? Later in the campaign, Montgomery would deny Edwards leave to allow him to campaign, which ended up causing the sitting sheriff more PR headaches than it was worth.

When the sheriff’s deputy association took a confidence vote on Montgomery that year, he received a majority by just a whisper, 51 to 49.

From the Olympian:

Some deputies were upset at Montgomery, saying he maintains an aloof posture in the department and isolates himself from the rank and file members. Morale was described as being low.

Edwards would end up beating Montgomery in the Republican side of the then not-Top Two primary and then dispatching a Democrat in the November general. He would serve until 2006 when he was replaced by Dan Kimball (who he endorsed) and then John Snaza (who Kimball had endorsed). 

Now come Deputy (and now Sheriff-Elect) Derek Sanders in 2022, who was more than ten years younger than Edwards when he entered the race for sheriff. He represents a similar kind of inside the house phenomena. He was endorsed by two former top administrators that served under incumbent John Snaza.

Look at this Edwards ’86 endorsement from then Deputy Paul Ingram:

“(Montgomery) has been one of the best sheriffs we’ve had. But the last two years, he hasn’t taken advice from anyone. He has lost two key administrators because of that. He’s taken by the power of the office.” 

And this endorsement for Sanders in 2022 from former Thurston Sheriff Chief Dave Pearsall:

“In the beginning (Snaza) had good ideas, intent, and vision. Unfortunately, it no longer appears this is the case. The Sheriff has lost any forward-thinking and vision as of late, which is likely why his Deputies considered a ‘vote of no confidence’ against him.”

This hand-off endorsement framing is interesting for people inside the institution to do, apparently. The sheriff’s office in any given county in Washington is huge, institutionally speaking. Criminal justice spending makes up a big part of the county budget. And the sheriff’s office is a big part of that piece of the pie, and is arguably the most public. So, people “inside the house” can protect the institution itself by saying “he used to be good, but now he’s bad, and I want this next person who is also one of us.” 

The call is coming from outside (but also inside) the house

That being said, it is also important for the rebels inside the house to connect with the mainstream of politics in the community. And, for a non-incumbent campaigner, this is not a small accomplishment. Because the sheriff sits at the top of such a huge public institution, it isn’t that easy for other elected officials to stand up and endorse a challenger.

In 1986, Edwards was able to round up institutional support across the county, including two mayors of Olympia. Sanders was able to match that this year, rounding up dozens of mayors, city council members and former and current state legislators from around the county. 

When Edwards faced an inside the house challenge in 2002 from Deputy Glen Quantz, he diffused the institutional support from lining up with the support that the deputy had gotten from the rank and file. The key was Quantz’s personal life (a bankruptcy and juvenile larceny conviction). Then Attorney General Chris Gregoire pulled her endorsement after Quantz’ past came out.

Edwards would end up not running again in 2006, heading off any potential inside challenge that was able to unify the rank and file with the political mainstream of the county.

Why this is an important discussion

For Troyer, his opponents in 2020 seemed to have reached the level of “inside the house” challenges. Even though he wasn’t an incumbent in 2020, his profile as the department’s communications director gave him a profile that was much higher than any other non-incumbent. The deputy union endorsed an unsuccessful primary candidate and Troyer’s official general challenger (who was also a sheriff’s office lieutenant). But, where they felt short, it seems, was uniting an inside challenge with the mainstream of Pierce County politics. 

Lt. Cynthia Fajardo raised more than twice what Troyer raised, but the vast majority of her funds were donations from herself. Running a self-financed campaign doesn’t signal trying to reach out and gain endorsements from a broad vein of the mainstream institutional politics in Pierce County. It was Troyer that received the endorsements from the 30th District Democrats and the Puyallup Tribe of Indians.

Michael Zoorob explored the sticking power of incumbent sheriffs, pointing out that they are able to hold off challenges the vast majority of the time. They even have longer tenure than appointed police chiefs, and self admittedly, are more secure in their jobs from political fall-out. 

Specifically zooming into Pierce County, there seem to be some institutional advantages for Troyer coming into 2024 according to Zoorob:

1. Incumbent sheriffs tend to do well in the crowded attention years of Presidential elections. In fact,  sheriff elections on Presidential cycles are the most likely to be uncontested (compared to most contested in odd-year elections). When incumbent sheriffs are challenged during Presidential years though, according to Zoorob, the incumbent advantage disappears. It is basically the same as during any other kind of cycle.

2. The sheriff position in Pierce County is non-partisan, which also favors a sheriff with good name identification. The theory is the partisan marker is valuable information for the voter, and without that, they will lean on what they do know which may end up being the candidate they’ve even heard of.

A deeper look into Sheriff Sanders’ Thurston County

In my original post about the results from the 2022 general election, I vaguely pointed to results comparing how well successful candidates Sheriff Sanders and Senator Murray did against each other. Basically, both won by doing well in the dense, urban part of Thurston County. But, when you take their precinct results and compare them, you see Sanders lagging behind Murray in those dense neighborhoods and holding on tighter in the rural areas.

Here is the map (with legend!) that compares Murray (doing better in red) vs. Sanders (better in blue).

Because Murray did better overall in Thurston County, (58 to 55 percent) it is interesting to look at the places that Sanders not only won overall, but beat Murray. Here is the map with those precincts outlined in red.

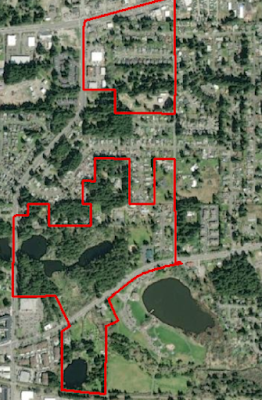
The smallest pockets are places like Kinwood East (on the edge of Lacey) and Simmons 3 (on the edge of Tumwater):

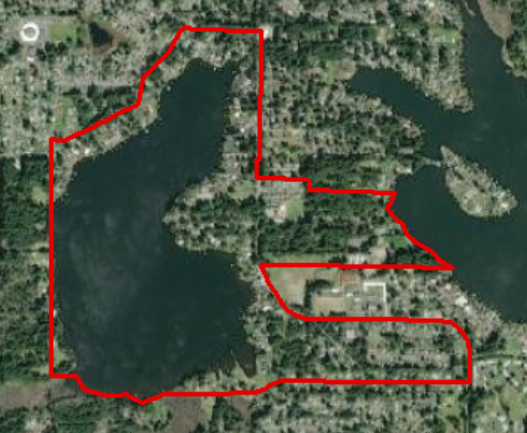
Kinwood West
Simmons 3

Both of these are annexation candidates that have very few votes (about 90 in Kinwood West and fewer than 20 in Simmons 3). So, dense precincts that, if mixed with a larger city district, would likely have voted for a Democratic Senator.
The next collection are Lacey 28 and Lakeside. Both of these are (aptly described) are lake shore precincts. 
Lacey 28
Lakeside

What is at play here? Higher property values? The general lake shore politics that gives someone a unique perspective on county government? 

Lacey 28 is also the only incorporated precinct that falls into this collection, other than the entire city of Tenino, which is the third collection of precincts in this map. Why Tenino didn’t go vote for Murray makes sense, but why it voted for Sanders is worth discussing.
The last collection are the larger precincts around the edge of the urban growth area. I might have added Johnson Point (off the map) into the lake shore collection, but I’ll put it here with places like Delphi, Sunwood Lakes and Eaton Creek North.

These mostly wooded or rural precincts are pock marked with surban-esque neighborhoods carved out of the woods. But at least one looks like it could be plopped down directly into Hawks Prairie or Southeast Olympia:

Riverwood neighborhood off of Rich Road.

So my guess? These neighborhoods are far enough out of town that their politics would at least be marginally conservative. Or, at least conservative enough for Tiffany Smiley to edge out a win over Murray. All of these precincts were 45/55 precincts for Murray. But, they are also all neighborhoods that depend on the Sheriff’s office for police services. And, if they are generally unhappy with the service they receive (because of response times, they are likely to vote for the challenger over the incumbent. 

Some maps to help you understand the November 2022 General Election in Thurston County

1. Sanders won the Sheriff’s race leaning on urban voters, but…

Here are Sanders’ results in raw numbers. Blue he did better, and red worse. This is the prototypical Thurston County partisan map. Democratic candidates tend to do better and run up the score in the urban areas, and try to tamp down their losses in the rural precincts.
This is the map of taking Sanders’ percentages and taking away partisan ballot headliner Senator Patty Murray. What this map shows is though Sanders used the core of Olympia, Tumwater and Lacey to beat Snaza, he underperformed the top-of-the ticket Democrat to do it. Importantly to his win, he outpaced her in the rural areas.

Most importantly (and I think key to his win), there is a band of precincts close to the urban growth boundary where not only did he win the majority of the votes, but he outpaced Senator Murray.

2. The proposals to expand the county and port commissions passed, but exposed differences in opinion between the two bodies. 

First, the results from the county proposition:

And then the thinner, but also successful map, for the port. Same pattern, same broad victory. Just, thinner.

Both of the maps show the same general pattern we usually see, urban Thurston County voting one way, and then the further out of town you get, people vote another. What I was always curious about in this race is where the county did better than the port and vice versa.

In the map above, green areas saw more Port support vs. the County. But because the port was underwater vs. the county in all but half a dozen precincts, most of the green precincts are places where the county actually pulled more votes. I just did it this way to show variation. Doing it plus/minus 50 percent for each just showed a lot of pro-county areas. 

It is an open question whether these results are more about the county’s reputation or the ports. But it is worth pointing out the cluster of green precincts (pro-port or anti-county) around Hawks Prairie and the Yelm area.

The semi-rural breakwater in Thurston County politics

 I’ve oftentimes described the geographic nature of (mostly) partisan politics in Thurston County. 

If you are a Democrat or left of center, you try to drive up your margins in the areas close to downtown Olympia. Then you drive outwards in all directions and try to win as many other precincts as possible until you run out of time and money.

If you are a Republican or right of center, you start in South county and push in towards Olympia. 

There are exceptions to this rule. But these are usually non-partisan races where the typical left/right politics get subverted. Sue Gunn when she ran for port commission springs to mind.

In this simpler out from Olympia, in towards Olympia model, I have always wondered where the meeting point actually is. Where are the places where a normal liberal and Olympia-centered candidate could hope to win before they run out of steam?

It turns out, it is the corner of College and Yelm Highway in Lacey that acts as the lynch-pin to a series of dozens of precincts that are our true battleground. I came up with this by looking at how the two county commission races are finishing with such disparate results. Carolina Mejia is leading C Davis by a much larger lead than the difference in the Michael Steadman and Gary Edwards race. So, there are precincts that both Mejia (on the left and Olympia-centered) that Edwards (on the right and south county centered) are winning.

Below are the places they both won:

I also did a map showing the precincts that were both won by Republican Dusty Pierpoint and won by the two other Democratic legislative candidates, Sam Hunt and Laurie Dolan. There was about an eight-point difference between Pierpoint’s loss and how the Republicans running against Hunt and Dolan.
So, starting from the Yelm Highway and College Street intersection, there is a wide band of precincts heading north all the way to Puget Sound. Then, along the south side of Yelm Highway, there is another line of precincts that stretch all the way to the Black Hills.
On first blush, these are largely incorporated precincts but are either close to or are in the cities’ urban growth boundaries. They’re also within the school district boundaries of the three large north county school districts. So culturally, these are not true rural “South County” areas. There are a couple (South Scott Lake and South Union) that probably qualify as South County.
« Older posts

© 2026 Olympia Time

Theme by Anders NorenUp ↑