This post will play off my last one where I talked about how the power elites (a term coined by Steve Salmi at Green Pages to describe non-progressive or transactional candidates) could not expand their geography after the August primary. What was the most important geography for the slate of progressive candidates in Olympia, especially compared to other recent progressive candidates?
Before I start (again), here is some deeper reading for you (again):
Here are all the spreadsheets and map I’ve been working from. The data is from only a day or two after the election, so as counts march on, things will change obviously. But in terms of making maps, I think these will more or less stand pat.
For further reference, Adam Peterson did some really great shapefile based maps that he posted to Thurston Progressives.
Marco Ross ran for mayor against Cheryl Selby in 2015. He is the most recent progressive candidate for city council and I’m using his results to compare to this year’s successful slate.
Literally, the answer to where they did better is: everywhere in Olympia. The smallest margin of difference between the average progressive percentage two years ago and this year was 14 percent. But even taking that into consideration, there is still a geographic story to tell.
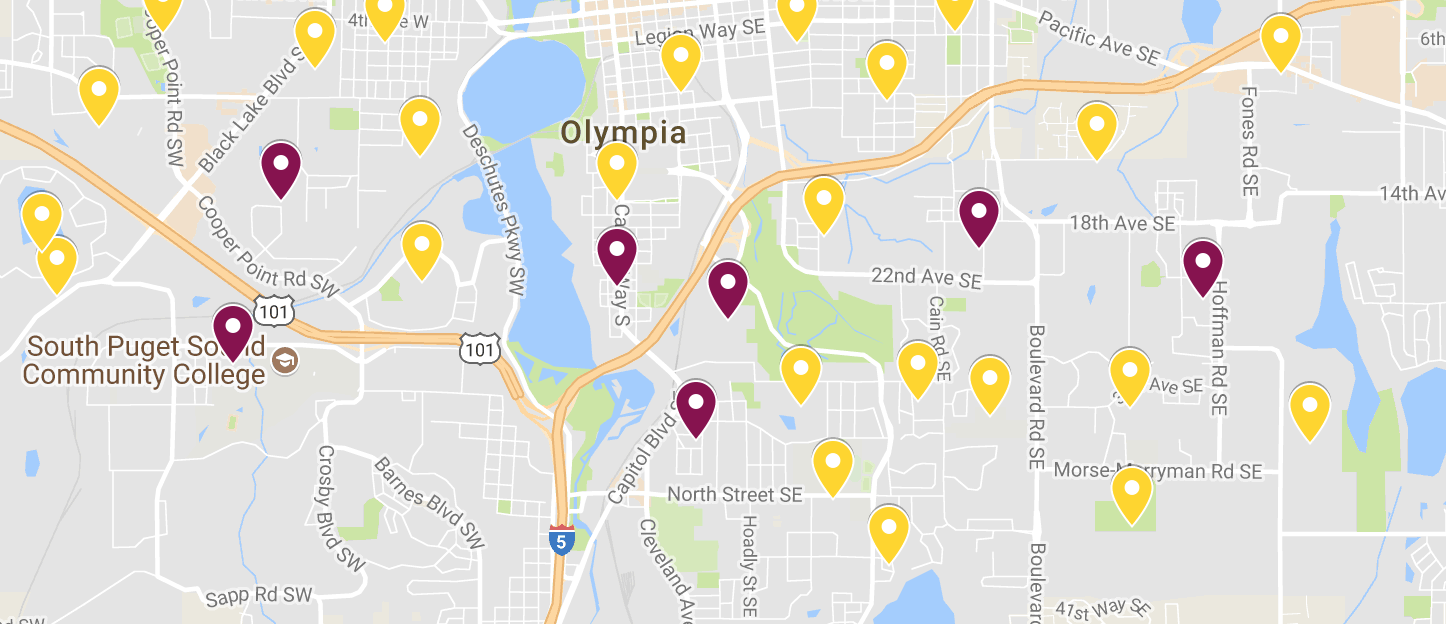
So what I did with this map was isolate the top 14 of 57 precincts (in total) by how much better they did this year than two years ago:
What I see is a band of precincts above the SE Olympia core along the highway on the Eastside (extending to a couple on the westside. Then a series of precincts running up the spine of the upper Eastside and then a few out on the rim of the city.
Progressive candidates this year did do well everywhere, but where they did best was not in their core areas along the water or inside the SE Olympia bubble of their opponents. They carved out their greatest success between the two geographic powerbases along the interstate and then in far outside neighborhoods.


Leave a Reply