History, politics, people of Oly WA

Author: Emmett O'Connell (Page 13 of 177)

What does a medical exemption from vaccination mean in the Olympia School District?

Measles can be prevented.

Medical exemptions for vaccinations in the Olympia School District and Washington State might not be what they appear to be.

On their face, these exemptions allow children who cannot be vaccinated (because of weakened immune systems, for example) to waive vaccination requirements and attend school. But, from what I’ve been able to gather from a public document request from the Olympia School District, the differences between personal-belief and medical exemptions is murky.

So murky that (please read to the bottom), I wonder if doctors or any medical professionals are necessary for the medical exemption process.

Let’s work backward first to see how I got here:

About a month ago, while the measles outbreak in Clark County was still new news, I updated what the vaccination rate for schools in Olympia was like. This was similar to other times I’d done this update, there are some scary high exemption rates in Olympia schools. But this time I noticed a new wrinkle: the top schools for personal-belief vaccine exemptions were also the top schools for medical exemptions.

Top Medical (bold if on both):

1. Olympia Community School (12.9 percent)
2. ORLA Montessori (8.5 percent)
3. Olympia Regional Learning Academy (6.3 percent)
4. Lincoln Elementary (4.6 percent)
5. Pioneer Elementary (2.7 percent)

Top Personal (bold if on both):

1. Lincoln Elementary (19.4 percent)
2. Avanti High School (17.6 percent)
3. Olympia Community School (16.1 percent)
4. Olympia Regional Learning Academy  (15.8 percent)
5. ORLA Montessori  (15 percent)

To me, this made little sense. If you were a parent of a child who had a medical reason to avoid immunizations, then I think you’d want to then use the herd immunity at your child’s school to help prevent infections. What I could see was that there was a correlation between parents who would seek a personal exemption from vaccines, ones that would seek a medical one, and the school they chose.

That made me assume that parents who are seeking medical exemptions are also not necessarily afraid to send their children into environments where a scarily low percentage of the children are vaccinated. This got me curious about the nature of medical exemptions in the Olympia School district overall.

So, I made a public records request for all medical exemption forms that represent active students in the Olympia School District. These are the documents I received and this is the spreadsheet I put together summarizing what I found (folder with both files here). The district blacked out student names and addresses before they gave me the documents, but they didn’t black out the names of doctors that signed medical exemptions.

Here is what I sussed out:

1. Naturopaths are slightly more likely to sign medical exemptions. While 25 percent of the medical exemptions I received from the school district, naturopaths only make up 20 percent of the provider types (family, pediatric and naturopath) that I assume would likely be presented with the form. Some forms were also signed by physician assistants and nurse practitioners.

2. Some doctors sign more than others. Like schools that seem to collect medical exemptions, some doctors seem to sign more than their share. This may be a consequence of who they see (people that are more willing to ask for a medical exemption), but I will probably never find that out. While a vast majority of the doctors who signed the forms only signed one, there were a few that signed several:

Jennifer Ash ND, 7
Lisa Barer MD, 6 

Amy Belko MD, 4
Bridget Sipher MD, 4
Kevy Wijaya MD, 4
Richard Faiola NP, 4

3. What does a medical exemption even mean? Over 75 percent of the forms had both the “medical” box and “personal” exemption marked on the form. This seems to undercut the meaning of the medical exemption form altogether. What may seem like an inexplicable bunching of both medical and personal belief exemptions (why would an immune deficient child attend a school full of unnecessarily unvaccinated children?) isn’t. What it really could be is just a larger group of children whose parents declined vaccination for personal beliefs but got their doctor to sign a medical waiver.

Then there was this:

You might have already perused the documents the school district gave me, but if you haven’t, this is (as far as I can tell) a full-on medical exemption form with no details, exempt the student’s name and a parent’s signature. No medical professional’s name, no medical professional’s signature. This isn’t even a double-marked personal/medical exemption. This is a pure medical exemption that is on file at the Olympia School District, that purported to clear a student to have not been vaccinated for medical reasons, with no medical professional’s name on it. 

If a parent can sign a medical exemption form and it be accepted by the school district, what is the point of even requiring them at all?

Where Olympia has lost population

When you think about population change in a growing region, you think of it as a constant. And, even though Olympia has been lagging behind Lacey in growth rate for the past few decades, Olympia is still on a gradual population climb.

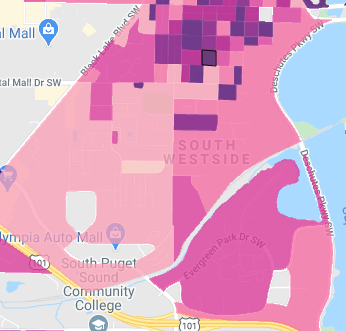
But, that population growth has not been consistently spread across the city. In fact, there are numerous neighborhoods that have actually lost a significant amount population in recent years.

To explore this phenomenon, I built a map in a tool called Policy Map. The variable I used was the rate of change in the five years between 2013 and 2017, according to the American Community Survey. These are interesting years because it was a time when the incoming population of our area outpaced new housing. So, at least in theory, our available housing became more crowded, not less.

A small caveat about this data. It is based on survey results collected by the Census Bureau. Being survey results it is less accurate than actual decadal census data. That said, all of these neighborhoods have seen measured losses of over 13 percent, which would probably outstrip any margin of error.

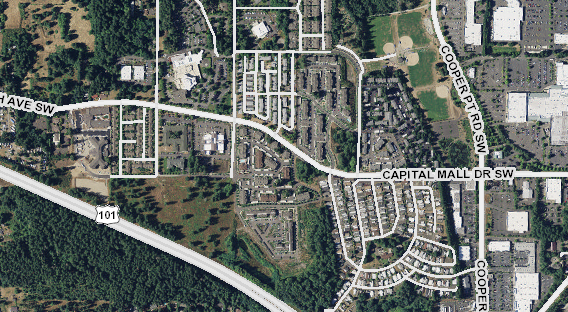
The first neighborhood in Olympia that lost a significant amount of population (again, more than 13.46 percent) was this one up in far northeast Olympia.

This Lilly to Southbay Road neighborhood is the outlier in the type of neighborhood that has lost population though. The much more typical neighborhood (in dark brown below) is an older, inner residential neighborhood.

Here’s the map key:
I’ve written about these neighborhoods before and in my mind, these are the neighborhoods that beginning in the late 1970s started seeing the impacts of growth cascading out of downtown. They experienced an influx of what we now call “missing middle” housing, multiplexes and small apartment buildings. But, instead of welcoming the growth and naturally more dense neighborhoods, these neighborhoods downzoned and pushed additional growth towards the edges of town. This new growth, in turn, paved over farms and forests.
But, why now are these neighborhoods that up until a few months ago were protected habitat for single-family homes losing population? Obviously, the neighborhoods weren’t becoming denser. I’m having a hard time finding data on the change in household size in the same year, but it stands to reason that stable households would have children age out eventually. If the parents stayed put, then theoretically, the population would decline. 

Your semi-regular update on what schools have low vaccination rates around Olympia

Usually, about when there is something in the news about an outbreak around here, I’ll go to the state Department of Health and find out what the vaccination rates are at our local schools (and here). This time around, there is a measles outbreak just about an hour south of us, so I thought it would be nice to narrow in specifically on exemptions (personal, religious or health) for the measles, mumps, rubella vaccination.

According to the most recent data, there are a handful of schools in the Olympia area with fairly high exemption rates for the MMR vaccine.

School Percent exempt for measles, mumps, rubella Percent with any personal and religious exemptions (not just MMR) Percent with medical exemption (not just MMR)
OLY REGIONAL LEARNING ACADEMY 16.2% 22.1% 6.3%
ORLA MONTESSORI 15.5% 23.5% 8.5%
OLYMPIA COMMUNITY SCHOOL 12.9% 29.0% 12.9%
LINCOLN ELEMENTARY 12.7% 24.0% 4.6%
GRAVITY 12.5% 12.5% 0.0%
AVANTI HIGH SCHOOL 12.0% 19.0% 1.4%
Paramount Christian Academy 9.1% 9.1% 0.0%
TUMWATER WEST 9.1% 9.1% 0.0%
NOVA SCHOOL 8.6% 10.5% 1.0%
PIONEER ELEMENTARY 5.9% 10.6% 2.7%
BLACK LAKE ELEMENTARY 5.7% 7.7% 1.7%
REEVES MIDDLE SCHOOL 5.1% 13.6% 2.0%
MICHAEL T SIMMONS ELEMENTARY 5.0% 6.7% 1.4%
THURGOOD MARSHALL MIDDLE SCHOO 4.9% 8.2% 1.8%
BOSTON HARBOR ELEMENTARY 4.7% 8.3% 2.4%
ROOSEVELT ELEMENTARY 4.6% 7.2% 1.7%
GARFIELD ELEMENTARY 4.6% 9.9% 2.2%
EVERGREEN CHRISTIAN SCHOOL 4.4% 7.8% 0.0%
TUMWATER HIGH SCHOOL 4.1% 6.5% 0.8%
NEW MARKET HIGH SCHOOL 4.0% 4.0% 0.0%
EAST OLYMPIA ELEMENTARY 3.9% 5.5% 0.4%
MARGARET MCKENNY ELEMENTARY 3.9% 4.2% 0.0%
OLYMPIA HIGH SCHOOL 3.9% 9.6% 0.3%
JEFFERSON MIDDLE SCHOOL 3.9% 6.6% 0.9%
CENTENNIAL ELEMENTARY 3.7% 5.4% 1.1%
BLACK HILLS HIGH SCHOOL 3.7% 6.4% 1.5%
CAPITAL HIGH SCHOOL 3.7% 7.0% 0.6%
PETER G SCHMIDT ELEM 3.7% 4.5% 1.0%
GEORGE WASHINGTON BUSH MS 3.5% 6.7% 0.6%
LITTLEROCK ELEMENTARY 3.1% 4.5% 1.4%
SOUTH BAY ELEMENTARY 3.1% 4.1% 1.0%
TUMWATER MIDDLE SCHOOL 3.1% 5.0% 1.0%
TUMWATER HILL ELEMENTARY 3.1% 4.2% 0.5%
WASHINGTON MIDDLE SCHOOL 2.8% 6.3% 1.0%
LACEY ELEMENTARY 2.8% 3.6% 0.8%
OLYMPIA CHRISTIAN SCHOOL 2.6% 10.5% 0.0%
LYDIA HAWK ELEMENTARY 2.5% 3.1% 0.2%
MEADOWS ELEMENTARY 2.4% 2.8% 1.0%
SOUTH SOUND HIGH SCHOOL 2.4% 3.0% 0.0%
SECONDARY OPTIONS 2.4% 3.9% 0.8%
OLYMPIC VIEW ELEMENTARY 2.3% 2.5% 0.9%
NORTH THURSTON HS 2.3% 5.8% 1.4%
NORTHWEST CHRISTIAN HIGH SCHOOL 2.3% 2.3% 0.8%
CORNERSTONE CHRISTIAN SCHOOL 2.2% 2.2% 0.0%
JULIA BUTLER HANSEN ELEMENTARY 2.2% 2.2% 1.1%
MADISON ELEMENTARY 2.1% 5.4% 0.0%
GOSPEL OUTREACH 2.0% 2.0% 0.0%
HORIZONS ELEMENTARY SCHOOL 1.9% 2.6% 0.9%
L P BROWN ELEMENTARY 1.8% 2.4% 0.3%
COMMUNITY CHRISTIAN ACADEMY 1.8% 3.0% 0.0%
ST. MICHAEL SCHOOL 1.7% 3.5% 0.9%
KOMACHIN MIDDLE SCHOOL 1.7% 3.5% 0.9%
TIMBERLINE HIGH SCHOOL 1.7% 3.4% 0.4%
CHAMBERS PRAIRIE ELEMENTARY 1.7% 3.3% 0.7%
NISQUALLY MIDDLE SCHOOL 1.5% 2.7% 0.7%
WOODLAND ELEMENTARY 1.4% 2.2% 0.3%
RIVER RIDGE HIGH SCHOOL 1.4% 3.2% 0.5%
SALISH MIDDLE SCHOOL 1.3% 2.3% 0.7%
ASPIRE MIDDLE SCHOOL 1.2% 4.9% 0.0%
EVERGREEN FOREST ELEMENTARY 1.2% 2.8% 1.2%
HOLY FAMILY SCHOOL 1.2% 1.2% 1.2%
POPE JOHN PAUL II HIGH SCHOOL 1.1% 1.1% 0.0%
MCLANE ELEMENTARY 1.0% 2.3% 1.3%
CHINOOK MIDDLE SCHOOL 0.9% 4.0% 0.9%
MOUNTAIN VIEW ELEMENTARY 0.8% 2.0% 0.5%
PLEASANT GLADE ELEMENTARY 0.7% 1.7% 0.7%
SEVEN OAKS ELEMENTARY 0.7% 2.0% 0.2%
NEW MARKET SKILLS CENTER 0.3% 0.3% 0.0%
TOUCHSTONE SCHOOL 0.0% 0.0% 0.0%
CAPITAL MONTESSORI SCHOOL 0.0% 0.0% 0.0%

Here is the most recent data from the state and the spreadsheet I used.
What leaves me scratching my head about this data is that when you parse out the medical and personal exemptions, they seem to follow the same general pattern. Schools with high personal/religious exemptions also have high medical exemption rates. 
When I first started looking at this stuff, I assumed medical exemptions would be evenly dispersed across the area. It follows that since all of the schools that have high exemption rates are schools you either generally lottery into or opt into, that the personal/religious exemptions would gather there.  In the same way that opting into certain schools is an expression of a family’s choice, so is opting out of vaccination. But the medical reasons for not being vaccinated, I don’t think, would be more general and would not necessarily be tied to a family’s school choices.

If you’re new to this issue or just need some background, here is some information you might find useful:

Here is an explanation on how those exemptions work.

You’ve heard about herd immunity, or how the vaccination rate in a group of people that protects people who can’t receive a vaccine. This is why a 16 percent exemption rate at ORLA or a 12 percent exemption rate at Lincoln are sort of scary.

According to the CDC, an immunization rate of 94 percent is necessary to prevent pertussis from persisting in a community. That is above the 88 percent that the exemption rate at Lincoln would indicate is that school’s immunization rate.


The Timberland Library Capital Facility Proposal was a reflection of our current reality

Timberland counties have changed a lot since the 1960s. Thurston County used to be about the same size as the other four counties. Now, all four combined are smaller than Thurston County.

So far, the dominant narrative about the now shelved Timberland Library capital facility proposal has been about the possible closures and consolidations of rural libraries. Hardly anywhere in the coverage is a good understanding of the balance of where Timberland’s revenues come from and how that money is spent. It has been just calmly accepted that closing any rural library is a sin, notwithstanding gaps in service in other parts of the five county district.

Here’s a link to the draft proposal. It generally calls for consolidation of rural libraries buildings and the roll out of different types of library models (like Open+) that could have expanded hours.

During my tenure (between 2010 and 2016) on the Timberland board, we had to twice explain to east Lewis County communities that despite them voting to annex into the district that we would not automatically open libraries in their cities. Toledo and Morton both annexed, and because of the nature of the district (TRL doesn’t build libraries inside cities) and the budget (pretty thin), there was no way we’d vote to open new buildings.

The capital facilities proposal would have helped the board take a look at the hard issues of where to spend money, but unfortunately, the board of trustees put it back on the shelf in favor of what will probably be across he board budget cuts.

The capital facilities plan itself wasn’t a step back from serving rural communities, but a recognition of how the demographics of the district have changed and how library services have changed. It was also an acknowledgment that for decades the district has served some rural areas at the detriment of others.

I saw this process fold out slow motion when we were discussing the future of library services in Amanda Park. We had the option to close or drastically scale back services there because of some facilities issues with the library building. Stepping back from Amanda Park would have allowed the district to provide some service to the North Coast (Taholah down to outside Ocean Shores), which has always been part of Timberland but has never been directly served. But at almost the last minute, Grays Harbor County came through with funding to save the Amanda Park library and services there, and dooming any expansion into the North Coast.

So, there’s that, the choosing of one rural community over the other. Additionally, there is also the seemingly forced ignorance of leaders and activists in rural communities of how the library is even funded.

Take this passage from Brian Mittge in the Centralia Chronicle:

Timberland’s professional library administrators in their Tumwater headquarters should spend a lot more time out in their rural communities. They had planned an elaborate set of listening sessions. Maybe instead of that, they should also spend some time in the Randle mill a half mile from their library. Or go in the woods with some of those namesake loggers whose revenue still pays for a big chunk of Timberland’s operations.

Timber funds pay for less than 10 percent of Timberland’s budget and have been a shrinking part of the revenue stream for years. They are also extremely volatile, meaning the library cannot count on them from year to year. Property taxes, on the other hand, are stable and are making up a larger and larger portion of the district budget.

I want to pause and make sure this point is heard, because this has been missing from the coverage of the library facility debate so far: Thurston County, where more than half of the people in the district live and who pay for more than half of the budget, only receives 41 percent of the expenditures from the district. 


In fact, next year, Thurston County residents will spend $1.4 million outside of their own county on library services in Pacific, Grays Harbor and Lewis County.

From the Capital Facilities Proposal:

And, this isn’t just because Thurston County has the largest population, the most stable economy and valuable property. It also gets to the nature of the communities in Thurston County. It is simply just cheaper to provide library services in urban areas.
This is an interesting set of stats from the proposal:

–>

Daily Cost per borrower Cost per circ
Grays Harbor $38.97 $9.72
Lewis $31.72 $8.11
Mason $35.10 $9.47
Pacific $35.50 $9.08
Thurston $22.89 $5.92

It costs almost half per borrower and per circulated item to provide library services in Thurston County than it does in Grays Harbor County. And it cost significantly less than in any other county. This is because on average the libraries are larger and more popular, meaning economies of scale can be created making it less expensive per head to deliver services. People also live closer together, meaning no matter where you live in Olympia, Tumwater and most of Lacey, the trip to the library isn’t too far.

I understand we’re part of big library district. I understand that services in rural areas are harder and more expensive to deliver. But, I also want folks advocating for their branches in incorporated areas of rural counties to recognize that if my county were not part of an inter-county rural library district, we would have $1.4 million more to spend on library services. Pointing out to us that the library district was founded to provide services in the rural areas does not change the fact that if we left, we could maintain more than four Hoquiam-sized libraries in Thurston County.
Timberland Regional Library has a hard choice to make in the next year if we wan to stay afloat. We can cut services across all libraries and make them less valuable across the board. We can close and consolidate library services. We can also raise taxes.

But before we make those decisions, everyone needs to take a clear look at how this whole thing is put together.

Reducing impact fees will be great, but we need to talk about how we built our city

Next week the Olympia City Council will talk about an ordinance that will lower impact fees for affordable housing.

More specifically, the ordinance will lower impact fees for “housing with a monthly housing expense that is
no greater than 30 percent of 80 percent of the median family income.” The idea is that since developers make the most money building high-end housing for people that can afford it, this will create an incentive to build less expensive housing for those who can’t.

But in the short term, I think we should pull back and take a look at impact fees in general and what kind of housing this ordinance is likely to encourage.

First though, let’s say that impact fees are a one time fee for initial impacts that a new house will have on Olympia. Things like new roads, new parks, new schools are paid for out of these fees. But, long-term maintenance of these public assets come out of property taxes that end up being paid on the value of each home. So, while the initial burden of new homes can be blunted by impact fees, long term maintenance is everyone’s problem. And, that is when we get into choosing what kind of housing we choose to build.

Up until very recently, most of Olympia was locked into single family home only zoning. Now, more neighborhoods are open for what is called Missing Middle housing types, like duplexes, townhomes, etc. And, a lot of people are connecting this impact fee proposal to the Missing Middle proposal. Larry Dzieza’s post on Nextdoor about the cut in impact fees is even called “Missing Middle Tax/Fee Cut for Developers.”

What people aren’t talking about is that so-called Missing Middle development leads to higher valued properties, which leads to more taxable value for the city in the long run.

Here is how that works.

Generally, downtown Olympia is pretty valuable to the city and produces a lot of tax revenue (here and here). This is generally because the auto-centered suburban development style just isn’t as valuable.

Let’s get to another good example of how this is working in Olympia. Take this block of densely packed housing along Jefferson:

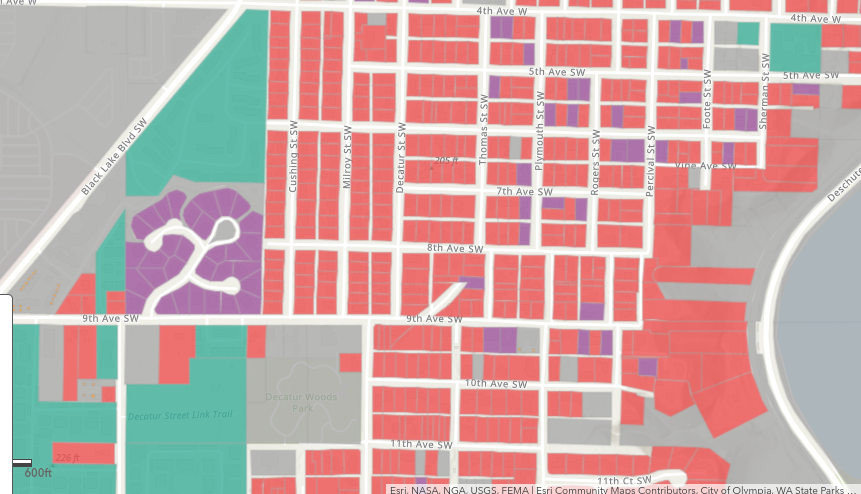
This isn’t likely anyone’s favorite place in Olympia, it sits on a stretch of Jefferson that has train tracks and is just a good example of what kind of housing we used to build downtown. At at just less than 10 percent of an acre it is valued at $2,661,538.46 per acre. When you look at the map, you can see it isn’t even out of the neighborhood in terms of value per acre.

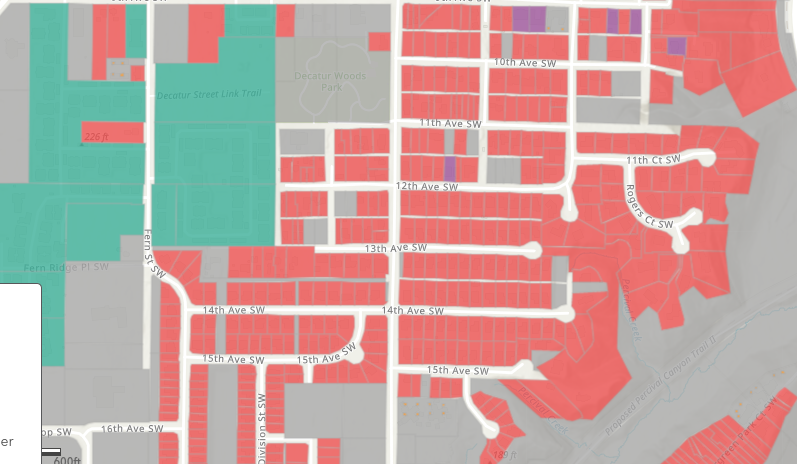
Let’s go a few miles south on 37th Street, south of Olympia High School a block or so. This is a neighborhood of single family homes in a neighborhood with no sidewalks, and though it is walking distance to two schools and a couple of churches, isn’t really what anyone would consider walkable in general.

And, these four house, clocking in at just over an acre, are valued at 1,617,475.73 per acre.

And, looking at this map, you see very similar values per acre among the neighbors.

Another way to look at it is to think about what value is being lost to the city of Olympia by sea level rise. Downtown Olympia by 2095 (if we don’t do anything) will lost about 370 acres and about $600,491,269 in total value. The land in low lying Olympia is valued at $1,631,769.75 per acre, Compared to the value of the land outside the inundation zone at $494,018.11.
So, coming back to the finances of the city. In the short run, we want more walkable neighborhoods filled with affordable housing of various sizes and types. So, we want to cut impact fees to help this happen. Single family housing is more expensive to the consumer (even using the data provided by opponents of the Missing Middle). But, because high density housing uses the land more efficiently, it ends up providing more taxes to the city itself, blunting the need for impact fees anyway.

How crossover votes doomed Bud Blake (and more maps from the election weeks ago)

Something I started noticing the last few months is how the geography of Independent and Democratic crossover voters seemed to follow a certain logic.

For example, if you took the precincts in Thurston County that voted for both Hilary Franz for lands commissioner and Gary Edwards for county commissioner, they seemed to generally fall into the geography that I’ve described as a general suburban belt between downtown Olympia and the rural south county.

Now for a second, I want to remind you how weird it is that there are places that voted for a guy who literally does not believe in land use regulation and also Hilary Franz.

In the same way that these neighborhoods combined their votes to support a liberal statewide candidate and an independent conservative candidate in 2016, a lot of the same places combined to support both conservative Independent Bud Blake and Democrat Maria Cantwell this year. But, they weren’t the same places. And because these crossover precincts shifted, Bud Blake wasn’t able to pull out a victory.


Just looking at the raw numbers, Bud Blake did worse. There were 21 precincts that voted for the Independent/Democratic combination in both years and 42 that only went for Edwards and Franz in 2016. Blake was only able to pick up 34 Maria Cantwell precincts to replace those Edwards/Franz districts he lost.

When you look at the geography, it gets clearer why Bud’s crossover precincts weren’t able to pull him over the finish line. They represent a shift in how voters arranged themselves on the map. In this map of crossover precincts orange is both 2016/18, red is only 2016 and blue is only 2018.

So, while it seems there is a lot of flipping (neighboring precincts going one way in 2016 and another in 2018) when you get down into the blue precincts that Bud Blake won alongside Maria Cantwell this fall, they have a slightly more rural flavor than Gary Edwards’ exclusive crossovers in 2016. While it could mean that Democratic voters were more enthusiastic this year, making places that had been Independent/Republican in 2016 Independent/Democratic this year, I don’t think that happened.

I think the action was more on the Democratic side of the commissioner race. And, while it seems close geographically, I think Bud’s Democratic opponent Tye Mesner moved the battle lines ever slow slightly further out towards the rural part of the county. While only being a few blocks here and there, by moving the crossover precincts that Bud Blake was able to win further away from the center of the county, he gained more votes in liberal precincts.

And yes, I know its been almost a month since election day and I’m usually much better about getting these maps out. I apologize.

In recent episodes of the Olympia Standard and OlyTalks, I talk about a few of these maps. Both these episodes are worth a listen if you want to hear me break these down. Or, if you have a question, just drop me a line.

Thurston County Commissioner
Thurston County Prosecutor
Thurston County PUD
Intercity Transit Prop 1

We used to tear down houses to build more houses. Until we didn’t

The most telling passage for me in this incredibly bad attempted takedown of sensible housing proposals in Olympia was this:

If you live in one of the older, near-town Olympia neighborhoods, big changes are looming for your neighborhood.

The way Jay Elder presents this is if to imply that this threat to older homes near the center of a city is new. That developers are just now getting around to licking their chops on older homes, after having developed all the old farms and ranches outside town. 
But in fact this is the opposite of what has always happened in Olympia. It has only been in the last few decades that “older, near town Olympia neighborhoods” have been protected from development pressures. I’ve written about the history of downzoning in Olympia. This is the process of taking what used to be areas zoned for higher density and putting it into a lower density. These processes in the late 70s through the 90s specifically protected near-town Olympia neighborhoods.
What happened after these downzones was that new housing was placed in areas that didn’t already have housing, such as old farms and ranches and forests. We protected older neighborhoods, we sprawled.
But, it hasn’t always been this way. It used to be in Olympia that as our city grew, we traded lower density, single family blocks for higher density blocks. This process has been going on for so long that some of these higher density blocks are now considered historic themselves.
The Weidner Auto Court on the north end of downtown is a great example of this process. The then hotel was built in 1929 on the site of a handful of single family homes. You can see these homes in an overlay of the 1924 Sanborn map:

One of the houses that we lost to what is now an apartment building belonged to Louis Ouellette. I can’t find a picture of that particular house, but the man himself seemed pretty impressive. He was the surveyor general for the county and he founded the Puget Sound and Chehalis Railway. Not no one but also not someone whose house was saved when it was time to change. 
I cant’t even find a photo of the Ouellette house online anywhere. When people think of old tragedies, houses and places we’ve lost (like the myth of I-5 destroying downtown Tumwater), I don’t hear people pining for the Oullette house. And now we look at the the auto court building itself as something historic that needs to be preserved.
My favorite example is the Columbia Manor Apartments one block over. In this overlay of that block you see a much larger home on the site of the 1939 apartments:

This was the Gowley house, which at at moment in history, was a historic home. It was an unofficial governor’s mansion, Gowley himself was an important statewide leader, his wife was a “Mercer girl” and he died oversees where he was serving as the consul general to Japan.

It was also an impressive looking house. From the Washington State Historical Society:

Any of those things would have qualified it to be saved today. But, in 1939 the house was gone (no one really knows the circumstances of its razing) and now we have 10 apartments for 10 families when once we had one house for one (wealthy) family.

When we freeze neighborhoods in time, when we throw around words like “established” to prevent opportunities for more housing for more families, we don’t allow our city to move forward. It is also deliberate ignorance of how our city has always developed. Nearby, lower density neighborhoods used to always get more dense.

We already know that “tear-downs” are happening in Olympia and Thurston County. But instead of being replaced by higher density developments in the past, we’re replacing older, more affordable single family homes with newer, more expensive, single family homes:

The single largest category of tear-downs in this analysis (which also includes Lacey and Tumwater) were single family homes replaced by newer single family homes. Older homes are going to get rebuilt by someone, someday. We might as well follow the traditional way of allowing older, closer in neighborhoods to become more dense.

Is the Independent era in Thurston County (and Washington) over?

Buried deep inside the results of the recent Crosscut/Elway poll was a surprising result, something that hasn’t happened in over four years, and not with any consistency since the Bush administration.

For the first time since January 2014, more respondents in a state wide poll said that they were Democrats and not Independents. In the last 12 of 15 polls taken since the beginning of 2008 that I’ve been able to track down, self identified Independents have been the plurality in Washington State.

Here is the data I’m working with.

The results in the Crosscut/Elway poll are not unexpected. Since 2015, the strength of Independent identification has been slackening. This narrow plurality of Democrats (37 percent to 35 percent Independents) falls into an ongoing trend.

On the surface, it seems like the strong hand of national politics is having a lot of influence in Washington State. While we saw a “normal” order of political identification in Washington during the Bush years, Independents started cropping up after President Obama was elected. And then, given the choice of another unpopular Republican president, Washington voters have begun to flock back to the Democratic label. It seems like the Democratic label in Washington is strongest when in resistance against an unpopular Republican administration. But, that support relaxes when a Democrat is in office.


I was able to track down some partisan identification data from the late 1990s, and it seems like you can see this trend is now repeating itself between the Clinton and Bush years. In 1996, 35 percent said they were Independents in Washington, but after Bush was elected Democrats were the plurality consistently through 2008.

So, bringing it home to Thurston County, what does this mean for our all Independent county commission? At the very least, not anything good. We’ve already seen that in the primary election, Independent Bud Blake has a much harder task to gather votes this time around. It seems clear to me that in our local elections, using the Independent label has allowed candidates like Blake (and Gary Edwards and John Hutchings two years ago) to obscure where they sit on the ideological spectrum.

How else can you explain Edwards, who literally does not believe in land use regulation, winning alongside Hillary Franz, a Democratic candidate for lands commissioner. There is literally no policy overlap between the two candidates, yet enough people made a contradictory choice of both Franz and Edwards to push him over the top.

It will be interesting to see with the power of the Independent label waning, what will happen with Bud Blake.

5 things to take from this year’s Thurston County primary election, mostly in map form


1. Holmes got smoked.

This doesn’t take much explaining, his overall percentage (32 percent) of the vote being what it is, seeing Stuart Holmes mapped out doesn’t give you much more insight.

At the very least, he follows the same north to south, liberal to conservative pattern that we usually see in Thurston County. Conservatives work from south to north, liberals the other way around. But is the independent label magic gone? I mean, I can’t expect he did much better as an Independent than he would have done as a Republican.

2. Where did these Minjares precincts come from?

One thing you can say about the Hall/Holmes race for auditor, is that it followed the typical south to north, conservative to liberal track of Thurston County. The Tunheim (as the conservative) and Minjares (as the liberal) results follow the same track.

But, Minjares won a handful of precincts both in the far southeast part of the county and out in Lacey. Alternatively, Tunheim won a lot of precincts inside Olympia that I would have assumed stayed on the liberal side of things.

There are different dynamics in play in this election than we’ve seen in local elections recently. Things like diversion programs and how prosecutors choose to advance cases aren’t your typical county-level land use questions we deal with. So, I’m wondering if we’re going to see a new map emerge.

3. Bud Blake lost in no small part because he lost ground in rural precincts

Bud Blake lost this primary even though he got the most number of votes. He finished with less than 40 percent of the vote, while the rest was largely split between two Democrats. You can say he lost because he wasn’t able to get distance from two Democratic challengers and as an incumbent, he trailed the 50 percent mark by a large margin.

But, I say the biggest reason he lost is that he lost to himself four years ago.

Most surprising in this map was how poorly Blake did against his own results in the primary four years ago. Sure, he lost votes in Olympia (not so many in the water facing districts, more in the newer neighborhoods). But he lost a lot of votes in the rural precincts, especially in a handful around Rochester. In some of these precincts, he ran twenty percent better four years ago.

4. What kind of voters are Denton voters?

Being able to predict what will happen in a few months in the general election depends on how the voters for a failed primary candidate decide to act. In this case, the voters who chose Melissa Denton will decide whether to support Blake or Menser. And where they decide to go depends on how they saw Denton. If they made the choice for her because they saw her as more moderate than Mesner, then Blake might actually pick up some of those votes. Even though I’ve heard people say she’s the more moderate choice, I’m not sure.

The most Denton precincts in this map seem to be a straight line from the outside of the Olympia westside into Tumwater, which gives some credibility to her being a moderate candidate or at least a moderate candidate from the voters’ point of view. But, she also won College, which is the most liberal precinct in the county. So, who knows?

5. Can Blake make it back?

This is a non-map segment, mostly just an explanation of how difficult I think it will be for Bud Blake to win in November.

So, we start with three things we know: Bud Blake got 35 percent in this primary, 48 percent in the 2014 primary and won the general in 2014 with about 55 percent of the vote. Because primaries for county commission are run in one of three districts and general elections are county-wide, you can assume that Blake found an increase of support in the other two districts in 2014. But that is not what happened.

If you pull apart the 2014 general results, he did slightly better in the third district (his home district) in the general with 55 percent than he did in the other two (54 percent). So, it isn’t like there is a new, untapped well of support out in those areas that haven’t weighed in yet. As it stands, he’ll have a harder time of it when the geography expands, if only slightly.

And, this year, he’s starting well further behind than he did in 2014. If you take the returns from the 2014 primary and general and extrapolate primary returns for the other two districts (like on the back of a napkin for example), Blake only finishes at around 45 percent in a 2018 general. But, that is only we consider his comeback in 2014 as the limit of his ability to climb.

Which, since we’re likely looking at a “blue wave” election this time around as opposed certainly not a blue wave in 2014, that ceiling for Blake might well be a hard one.

State conservation commission: Johnson and Mankmeyer should be removed from Thurston Conservation District board

Eric Johnson and Richard Mankmeyer should be removed from the Thurston Conservation District Board, according to a recommendation by the state conservation commission staff.

Their recommendation is outlined in the final report of a months-long investigation by the conservation commission into the last few years at the Thurston Conservation District. The report to state commission executive director Mark Clark and the commission members recommends Johnson’s and Mankmeyer’s removal based on multiple counts of neglect of duty and malfeasance.

For now, I’m simply reading the report itself and adding in details I find important. Basically, anything above the background links won’t change (unless I note it) but any additional information below that may likely grow. I’m setting this to post automatically publish just after 10:30 p.m. on Wednesday, July 18. But I’ll be adding more information to this and posting additional separate posts later on.

Also as usual with how I’m writing this, I’m trying to take care and clean up typos as I go along. But if you find some, just let me know on the sly and I’ll fix them. Thanks!

You can read the entire report here.

According to the report, the specific counts against Johnson are:

Exhibited Neglect in Duty by: 

1. Utilizing his position as District Supervisor to obtain special privileges or
exemptions for himself;
2. Not maintaining timely and accurate records of District business;
3. Not responding to public disclosure requests promptly,
4. Delaying the signing of District checks, and
5. Inappropriate conduct toward staff. 

Exhibited Malfeasance: 

1. By wrongful conduct in failing to participate in a scheduled hearing;
2. Inappropriate conduct toward staff creating potential liabilities for the district;
3. Failure to comply laws and rules of the state; and
4. Not allowing a supervisor to perform their duties.

And against Mankmeyer:

Exhibited Neglect in Duty by: 

1. Not maintaining timely and accurate records of District business,
2. Not responding to public disclosure requests promptly,
3. Delaying the signing of District checks and timesheets, and
4. Inappropriate conduct toward staff. 

Exhibited Malfeasance: 

1. By wrongful conduct in exhibiting inappropriate conduct toward staff creating potential liabilities for the district; and
2. Inappropriate conduct toward staff.

So, that’s is the basics of it but there is a ton to unpack here. For now, I’m going to let the above stand as a summary of what has been concluded by the staff. But I’m going to keep on writing below, adding stuff as I go along and see how far I can get.

First off, here’s a few links for background reading and listening.

Where it all started for me with this post: It’s time to acknowledge how messed up the Thurston Conservation District is and you should vote to change that.

My podcast partner and I did a great episode of The Olympia Standard that summarized what was going on out at the conservation district as of mid-February. You can listen to that here.
The Olympian joined in on the fun (here, here, here and later here). Hand to God, someone owes Abby Spegman a beer or something for getting this quote: “Joel and the bureaucratic bootlickers may not appreciate that, but that is my commitment to taxpayers. As a farmer, I’m used to dealing with manure and manure spreaders.”
As you might have surmised through clicking on some links and reading further, there was eventually an election that crystallized how people felt about the current leadership of the conservation district.

It turned out like this: Folks, how do you feel? Oh, you elected the candidate most opposed to Johnson and Mankmeyer? Like with record turnout? Despite a super messed up election system? (Another blog post I have about that) Wow, that’s great!

So, let’s keep going and circle back to the report itself. So, how bad are things out at the conservation district, really? Oh my god, so super bad. There are a lot of things that have gone bad at the district lately, but here are a few the pop out to me.

1. Johnson knows all about the manure spreaders. For this we know is true.

Remember back a few paragraphs when I said that I really loved the quote “As a farmer, I’m used to dealing with manure and manure spreaders.” I mean, Johnson was implying a whistleblower (Joel Hansen) was full of bullshit.

So, that makes this part of the report really super interesting to read:

The cost-share agreement requires implementation certification by District staff prior to a landowner receiving cost-share funds. Implementation certification requirement include a site inspection by District staff to verify completion and the project meeting required standards.  

When arriving at Johnson’s dairy farm he was unable to verify if the piping installed met the required standards as the pipe had already been covered. Johnson stated to Nygard the piping did meet the required standards and requested he approve the project so he could receive the funding. Nygard was hesitant to approve the project without being able to see how and what type of piping was installed. Nygard stated he felt pressured by Johnson to go ahead and approve the project. Nygard stated previously that Johnson had spoken negatively of other District staff to him. Since Nygard was close to retirement, he did not want to cause trouble with Johnson. Out of concern for possible retaliation from Johnson, Nygard went ahead and approved the project so Johnson could receive the funding. 

District Executive Director Kathleen Whalen stated in her interview Johnson approached her during the time he was installing the manure transfer system and requested of her to petition the Commission for additional funds to cover the costs of his project. Mr. Johnson had been approved to receive $38,000 in cost-share funds. She stated he continued to request of her to seek additional funds for his project. Eventually, she did approach the Commission and was able to receive an additional $4,296 for Johnson’s project. In the end, Johnson received $42,296 in cost-share funds for his project on his personal dairy farm.

2. Yeah, geez the timesheets and checks. Or, the gang who couldn’t approve minutes decided they wanted to start signing checks.

One of the most interesting wrinkles for me about this entire drama has been the story about how one of the board members wouldn’t sign checks. It has always been a fascinating part of government board membership to me that governing boards (city councils, trustees) actually approve all spending above a certain level on a check-by-check level by a government agency. In most cases this is done so quickly it is on a section of the meeting agenda called the consent calendar. Basically, it acts as a clearinghouse on the agenda to take care of regular boring business like what checks the agency needs to pay its day-to-day bills.

Real financial discussion happens when you put together an agency budget. Lots of discussion on the consent agenda means either a board member doesn’t understand the agency they’re leading or there is a lack of trust.

But for the Thurston Conservation District, it went somewhere deeper. I mean, obviously.

From the report:

Supervisor Mankamyer has refused for up to two months to sign District checks since his appointment as District Board Auditor during the November 1, 2017 District Supervisor meeting. Many of these checks were for reoccurring payments (rent, leased vehicles, utilities, etc.) already approved in the District’s annual budget. This has resulted in late fees assessed to the District and the District not following established fiscal procedures previously approved by the Board. 

Additionally, since Mankamyer has been appointed to sign Acting Executive Director Moorehead’s timesheets, timesheets have gone unsigned for over two months. Because timesheets must be submitted to various funders, the failure to sign the timesheets has created delays in billings to grants and payments back to the District.

Up until very recently, an accountant would actually sign checks approved by the conservation district board. But that changed: “On November 1, 2017, the board voted 3 to 1 (Johnson, Mankamyer, and Powell for and Fleischner against) to appoint Mankamyer as board auditor. Rushton was not in attendance and Fleischner expressed concerns to the chair on making appointments without the full board (Rushton) not being present.”

So, how did that turn out? Well, despite an insistence that the board needed to take direct control of the district’s finances and that he would train up, apparently Mankmeyer didn’t do so well.

From the report again:

Emails and statements from District staff established Mankamyer has been given ample opportunity to receive training, ask questions and be provided resources needed to fulfill his duties as appointed District Board Auditor. His actions resulted in the delay in payment of on-going expenses in violations of District policy.

« Older posts Newer posts »

© 2026 Olympia Time

Theme by Anders NorenUp ↑