This is a second blog post reflecting on some of the meta-lessons that came out of local elections in Thurston County this year.
The New York Times recently ran a story about how The Stranger sets the tone in Seattle politics. This is not breaking news for anyone who has watched Seattle politics for the last two decades.
The secret is simple: The Stranger shows up. It is consistently present, consistently relevant, and consistently part of the political conversation.
On a recent episode of The Olympia Standard, campaign consultant Rob Richards talked about the failure of the Workers’ Bill of Rights and how the yes campaign faced an uphill battle from the start. The opposition narrative was already circulating almost a year before the campaign really got rolling. And he’s right. The first public attention the idea got wasn’t from the campaign; it was from a flare-up of misinformation about a possible minimum wage increase more than a year earlier.
The campaign eventually launched with a petition drive last spring, but real messaging didn’t start until August. And in a town with fewer than half a dozen full-time local reporters, what earned media campaign can you realistically run? There simply aren’t enough people covering local government closely or consistently to help counter a false narrative once it takes hold.
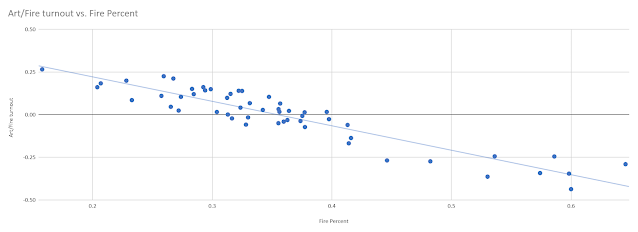
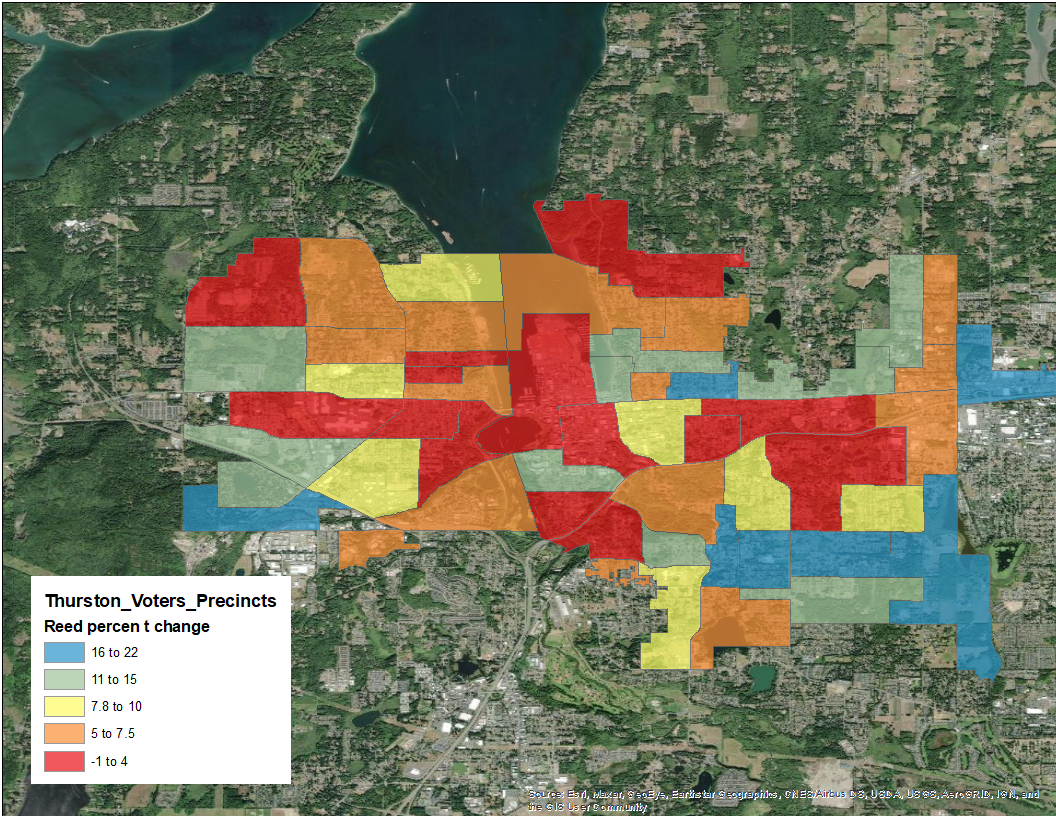
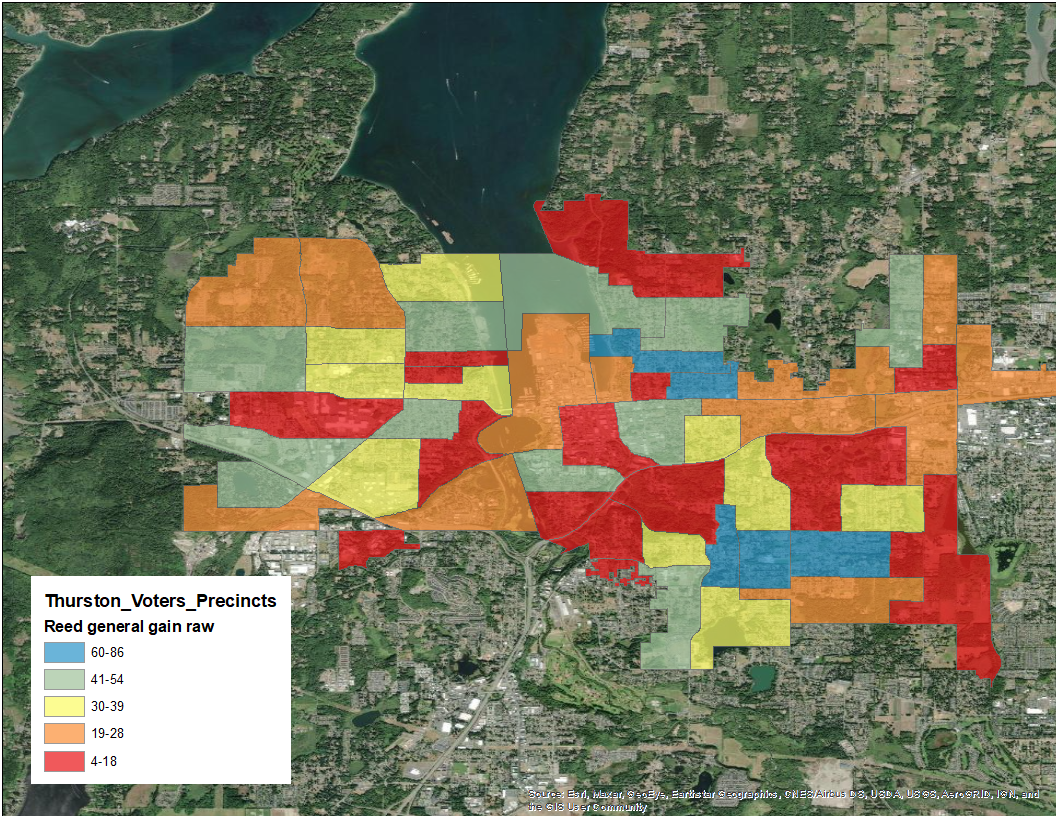
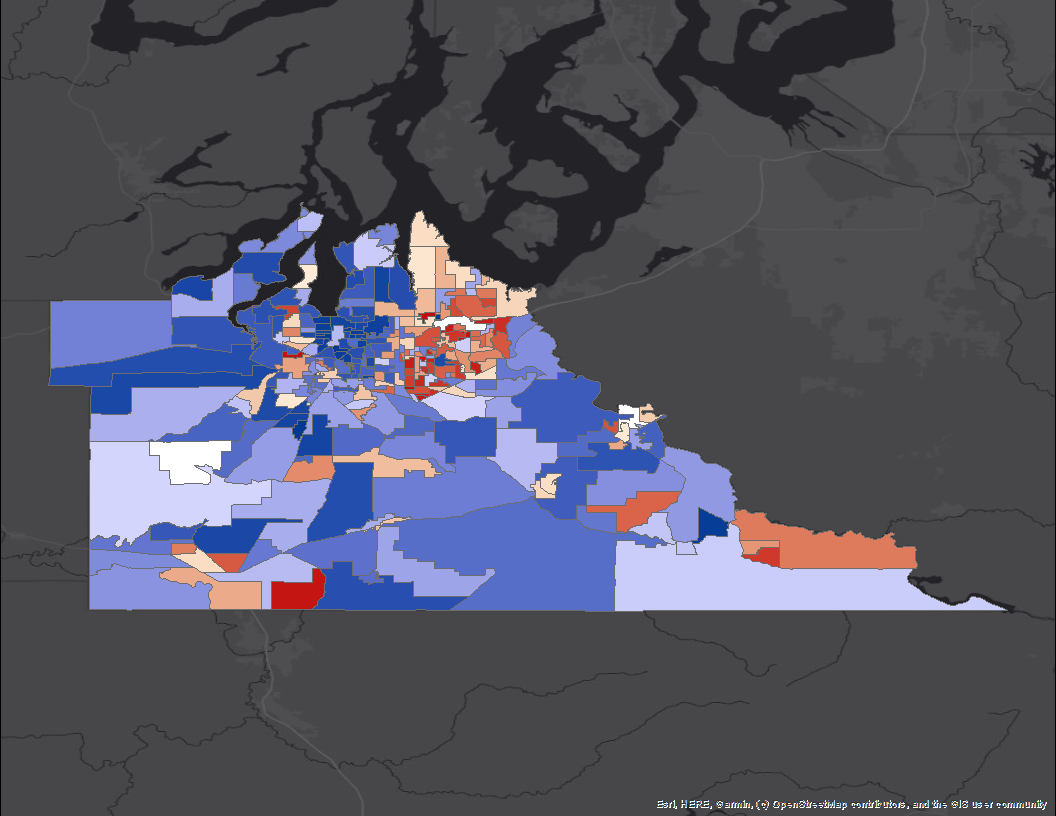
We saw this same dynamic in the Regional Fire Authority vote a few years ago. The JOLT, in particular, published a lot of stories leading up to the election that, while not necessarily inaccurate, clearly shaped the public conversation. The RFA election became a turnout election. The precincts that voted “no” were the ones where people just didn’t vote at all. Many voters were confused, caught between the campaigns’ messaging and the churn of coverage and commentary on social media. Faced with confusion, they defaulted to the “safe” choice: not voting or voting no.
I’ve heard some fair criticism that JOLT’s model (reporters overseas watching meetings remotely and writing from the recordings) made it difficult to provide the broader context of why the RFA mattered. That coverage tended to highlight debate and points of disagreement, because that was what stood out in public meetings. Without interviews, on-the-ground sourcing, or deeper reporting, the coverage didn’t really capture the larger picture of why the RFA might be beneficial. That isn’t a slam on the reporters; they were doing the best they could with limited resources and time.
Could the cities or RFA supporters have engaged more with JOLT? Absolutely. But it’s also fair to say that the resulting coverage skewed toward highlighting the questions and the drama, not the underlying case for the proposal. That imbalance, born from limited capacity, not ill intent, helped create confusion.
And that’s the common thread between Proposition 1 and the RFA: a negative discussion, powered by limited local reporting and social media algorithms that amplify emotional scepticism, grew in the absence of steady, contextual information. Confusion became the common voter experience, and in low-turnout elections, confusion is fatal.
What we need is clarity.
I generally appreciate news coverage. I’m not someone who gets angry every time a reporter writes something that makes a campaign uncomfortable. But we have to be honest about something: in a community with shrinking traditional media, campaigns still spend money on mailers and consultants and ads. But aren’t investing in the thing that makes campaigns possible in the first place: local media.
There’s been a lot of talk about how much the Prop 1 campaign spent on signature collection and basic campaign work. But how can complex, structural policy changes succeed when there isn’t a consistent media presence helping the public understand them? A community cannot hold informed elections without informed voters, and voters don’t have the time or energy to attend every meeting, read through every governing document, or fact-check every post on Facebook. That’s what journalism is for.
Which brings us back to The Stranger. It is only one outlet in a city that still has a relatively healthy Seattle Times. KUOW spends a significant amount of airtime on Seattle politics. Smaller niche outlets like PubliCola and The Urbanist also contribute to the political conversation. But for capturing the mood and narrative arc of Seattle politics, The Stranger is uniquely powerful, not because it is perfectly neutral, but because it is present, consistent, and willing to frame debates with a point of view.
In Thurston County, with so few journalists, coverage is often reactive. Journalism focuses on the easiest available material: summaries of meetings, recaps of official statements, and the occasional story on a high-profile incident. There isn’t enough capacity for the proactive, explanatory reporting necessary to unpack something like a Workers Bill of Rights. And when a reporter tries to be fair in that environment, “balance” can easily look like “There’s a real debate here,” even when one side is working with a year-long head start fueled by fear, confusion, and online misinformation.
Without sustained reporting, balance becomes ambiguity. And ambiguity becomes a “No” vote.
The absence of robust journalism means our community lacks the civic infrastructure necessary for democratic decision-making. The cost of a policy failing, of housing going unaddressed, fire services going unfunded, worker protections never advancing, is far higher than the cost of supporting journalism that helps voters understand what’s at stake in the first place.
If campaigns can’t count on local media to provide that clarity, then some of that investment needs to shift. Local media is not optional. It is foundational civic infrastructure. Until we treat it that way, we will keep re-running the same story: big ideas, complex policies, passionate campaigns, and a confused electorate that never gets the chance to truly understand the choice.