1. Did Talauna Reed’s strategy of encouraging voting in high density apartment complexes work?
2. Why did Reed get a post-primary bounce in SE Olympia?
And, it is more than the bottom line result that she did not win. When I look at the maps, she didn’t move the needle in the neighborhoods with large apartment buildings. I had seen this approach being promoted on social media, and I was incredibly interested to see if it would work (in a winning result) or move the needle (by improving her returns in neighborhoods with more large apartment buildings).
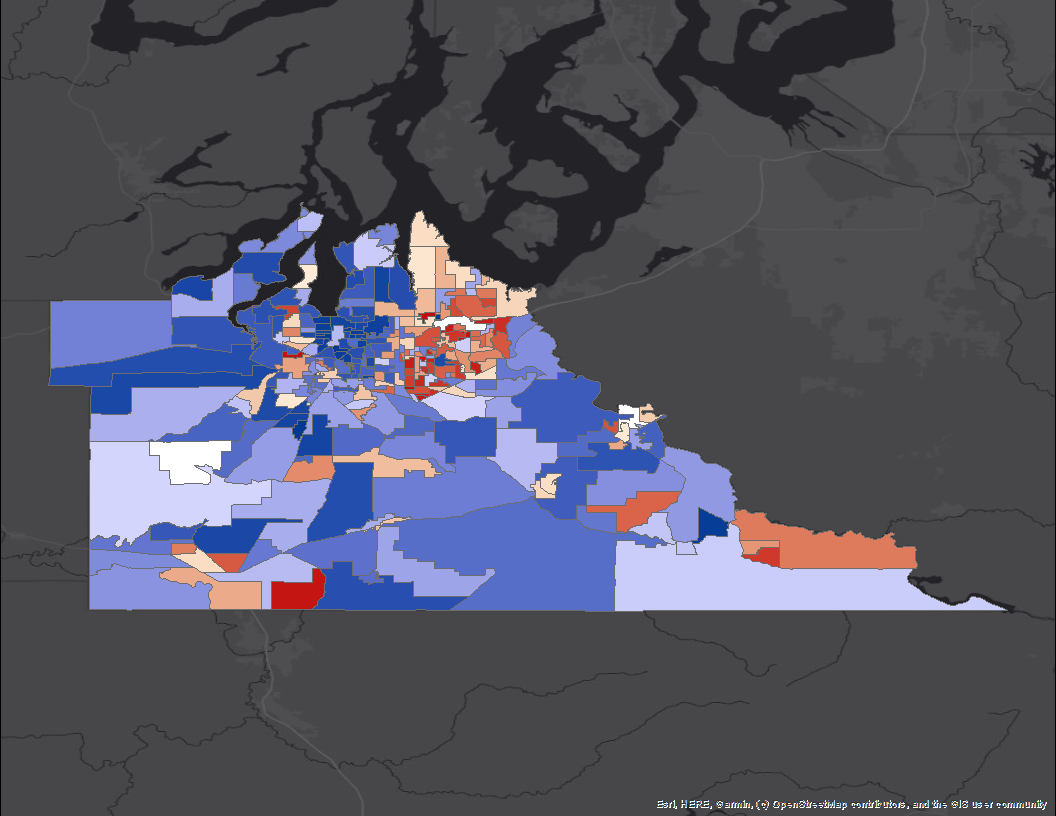
First off, here is the map for her overall vote percentage:
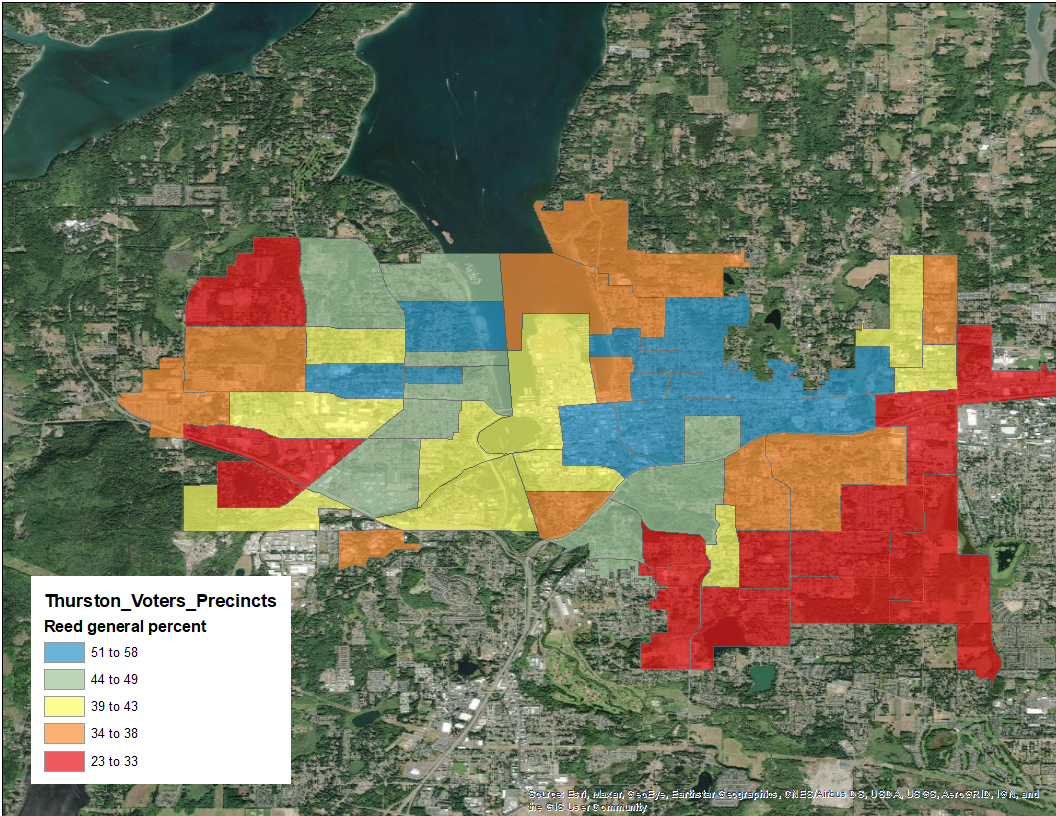
Her best precincts were basically on the Eastside north of the highway and on the near-in Westside. Only one of these precincts (the blue one furthest west) has a collection of larger apartment buildings.
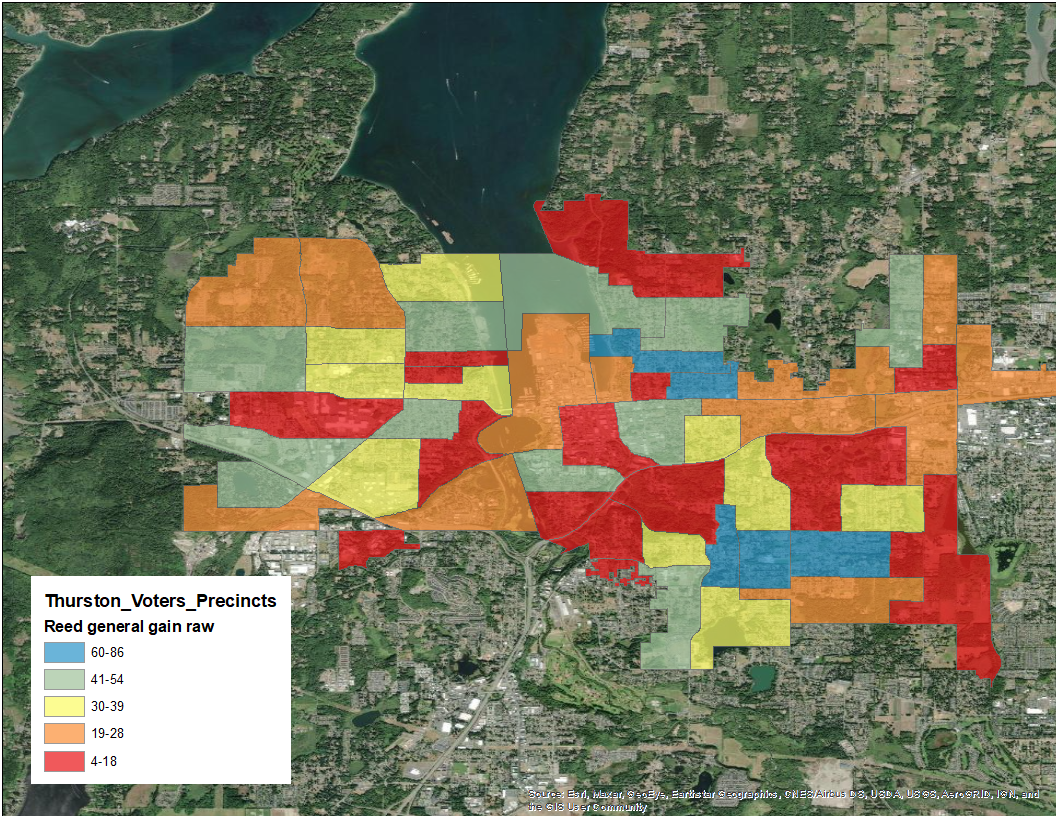
Since I heard about the approach to focus on larger apartment buildings after the primary, I think looking at the change in raw votes and percentage change would be important. This is especially true since the primary finished very close between Lisa Parshley, Reed and Wendy Carlson. This meant that Carlson’s large number of voters (for someone who didn’t advance) were up for grabs.
First, here is the percentage change:
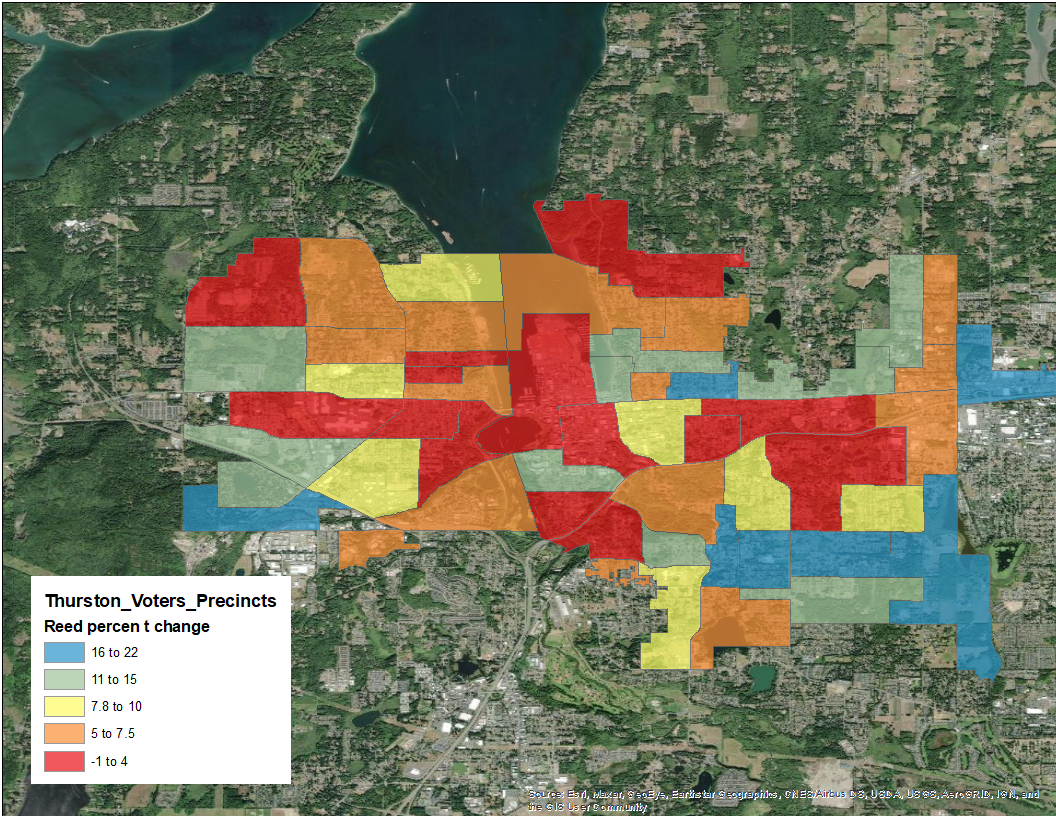
And here you might start seeing a pattern with higher turnout with apartment dwellers. On the far Eastside by the hospital and down South of Ken Lake there might be some movement.
But what is also consistent in these two maps in the handful of SE Olympia precincts where overall Reed did not do well. They also had large movements toward her during the primary to general shift. These are places where Carlson had a lot of votes to give up after she didn’t make it through the primary. And despite not doing well, Reed picked up a fair amount of votes.
3. What is the meaning of the weirdest countywide map I have ever seen?
Eight years ago, I thought I’d seen the weirdest map ever when Sue Gunn won both extremely rural and conservative precincts and urban and liberal precincts.
For a reference of how a Thurston County results map should look like, look at the Amy Evans/Joel Hanson for Port Commission map. Hanson is in blue, Evans in red.
Here you see the traditional urban to rural way these maps are organized. Hanson does better in the urban center of Olympia, while Evans does better in the rural areas and builds in towards Olympia. The battleground are the suburban belts around Olympia, including Lacey, Tumwater and a bit further out. From this map, you can see Evans won this by limiting Hanson’s precincts to largely inside Olympia.
4. Why did the right lane candidates have such varied success across the map?
I didn’t want to do election results maps for the other city of Olympia races, because they all seemed to follow the same pattern of conservative candidates doing well on the far Westside and SE Olympia and the eventual winners doing well everywhere else. I did do Reed’s race because as the only one left in the progressive lane, she was unique.
Well, what I did do was map the precincts won by any or all of the candidates in the right-hand lane. Candi Mercer didn’t win any precincts, so she’s not on this map.
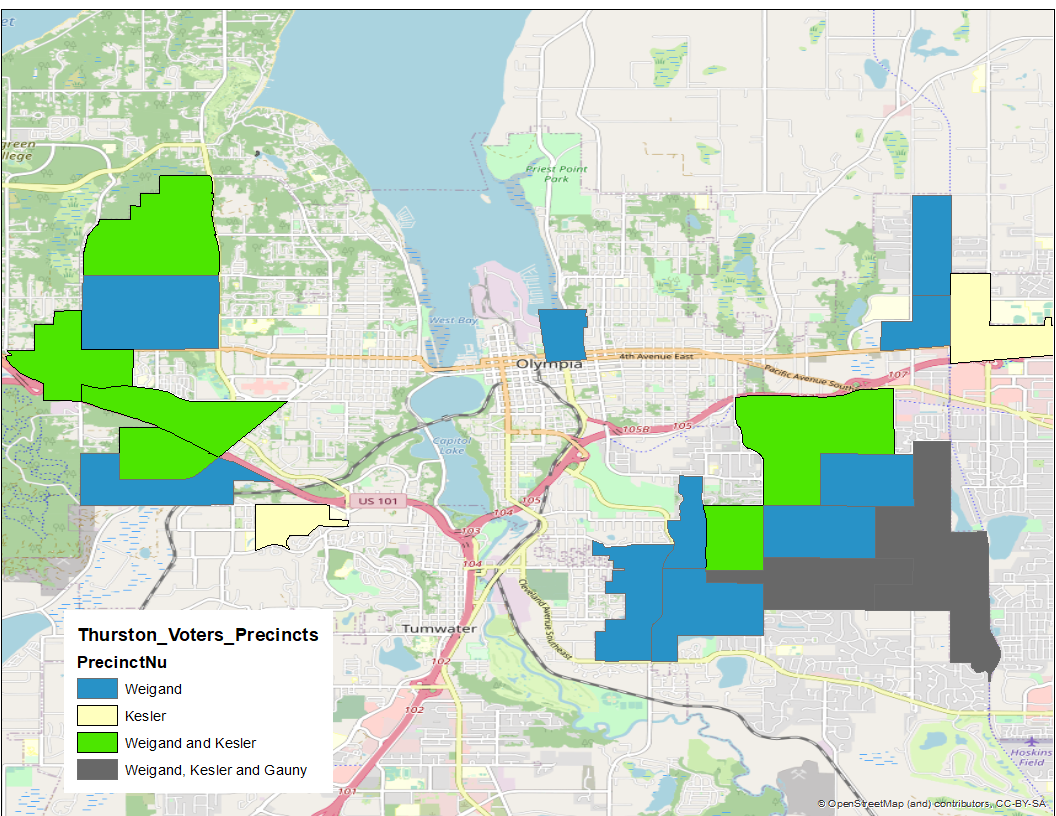
The three remaining (Weigand, Kesler and Gauny) won several precincts in SE Olympia together. Weigand and Kesler then combined to win a couple more on the SE side and on the far Westside (both traditional conservative-for-Olympia territory). Kesler then won two on her own, both on the edges of town. Weigand in blue then picked up the rest of SE Olympia and the far Westside. He also won an inside precinct that includes the East Bay Harbor condominiums.


I appreciate the maps of voting in the context of these questions Emmett. Thank you for doing the work to pull this together and exploring the questions. It is interesting to see the voting pattern by precincts. Like you, I was a bit surprised that Reed's campaign was unable to move vote in the multi-family/apartment heavy precincts. Her campaign did not have as much funding as Parshley, perhaps that is part of it? On the other hand, Weigand outspent Cooper by $50k and also was unable to move many new voters his way from the primary vote. It appears to me that Olympia voters supported candidates for council that advocate for continuing policy and funding to solve homeless issues. Voting by precinct for these candidates followed a similar pattern to the vote for the Olympia Home Fund in 2018. The Home Fund created a tax for making homes for homeless. Voters seem to understand that to resolve this issue takes money and time and will have frustrating moments, like the shootings at the Deschutes Parkway encampment just two weeks before the election. None of the challengers to the winning candidates articulated a path forward, some only suggested that they would move the homeless out of our view by not enabling encampments etc. Voters seem to get that it takes a real program and is not easy.