History, politics, people of Oly WA

Category: Tumwater (Page 1 of 2)

Captured Current

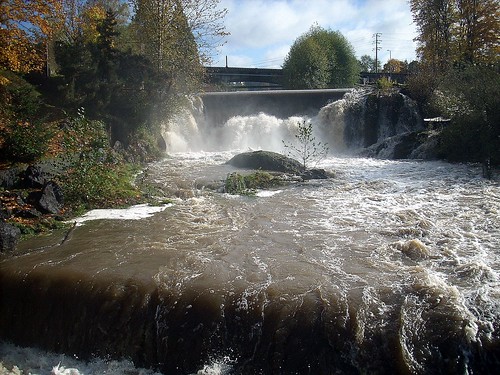
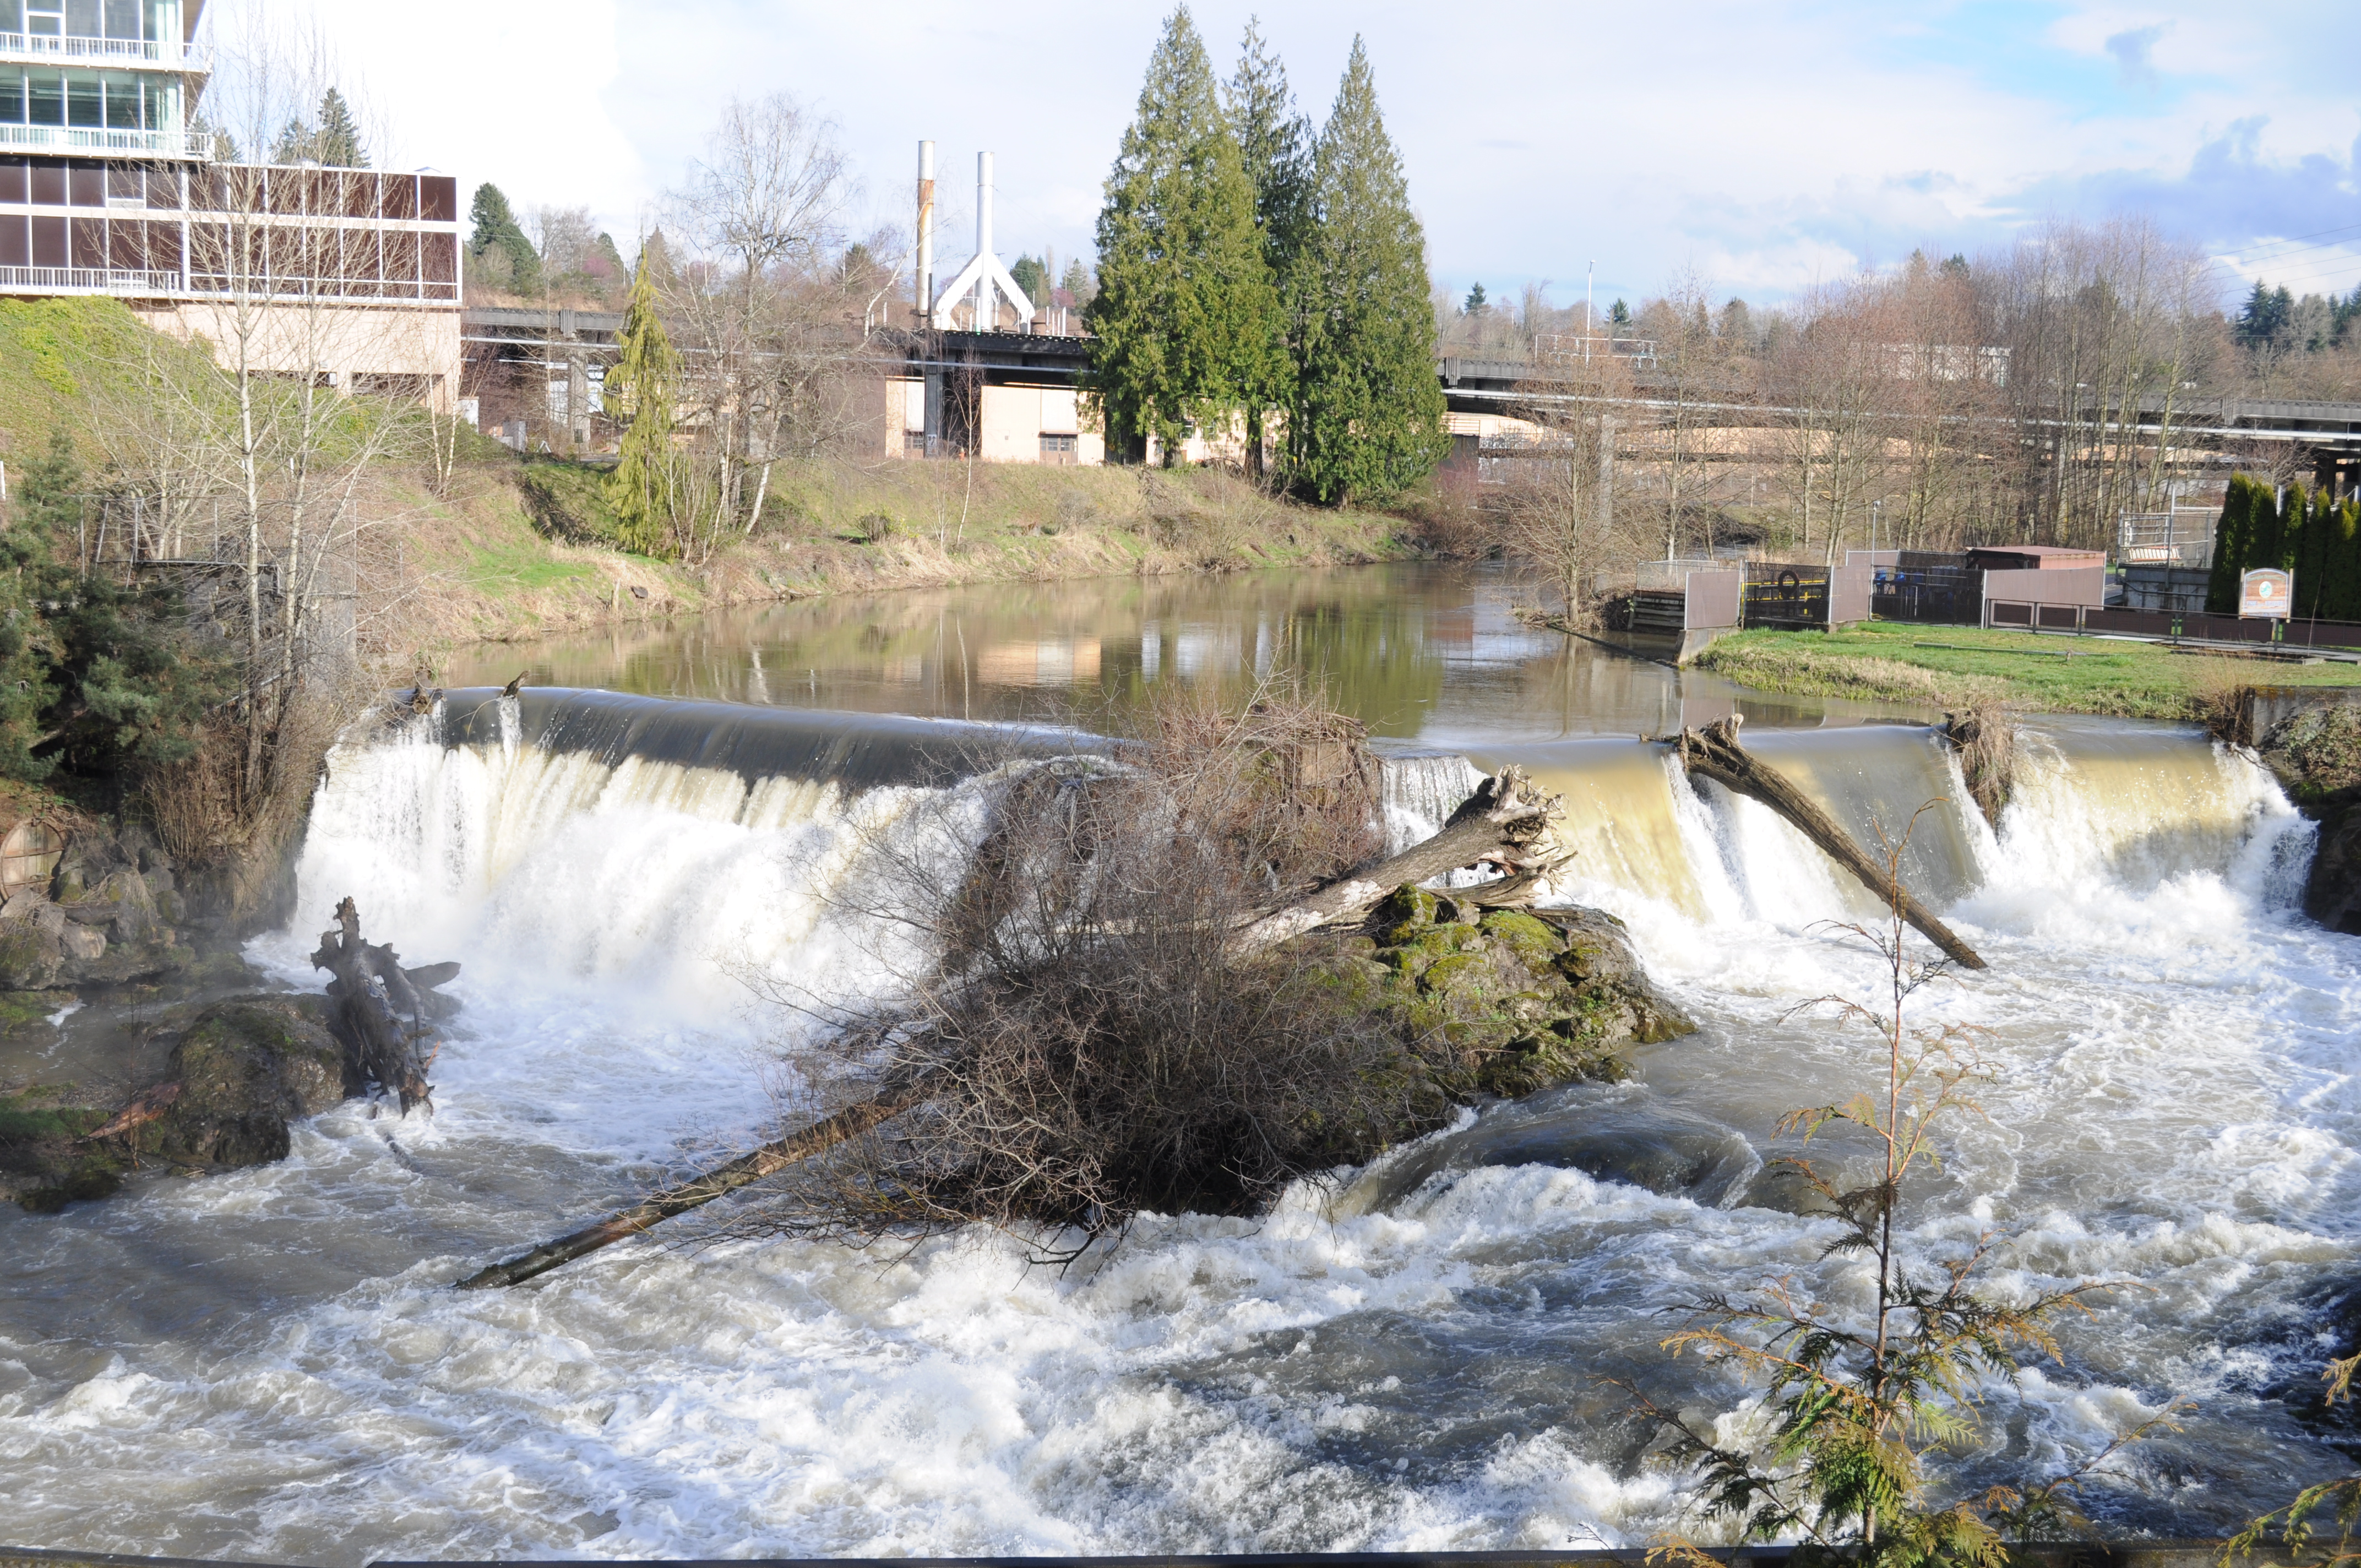
When you walk into Tumwater Falls Park, the Olympia Tumwater Foundation office is on your left and the WDFW hatchery facility on your right, directly ahead of you is the uppermost falls in the park. Google Maps marks it as a waterfall. Of course it does. Any water falling over a ledge looks like a waterfall, and this one photographs like one too.

It isn’t one. What you’re looking at is a dam.

The dam creates the waterfall, so in a narrow sense you’re not wrong to see falling water and call it that. But the structure underneath the water is not a natural feature. It was built, on purpose, by a company that needed it, and it’s worth remembering that before you remember anything else about this park.
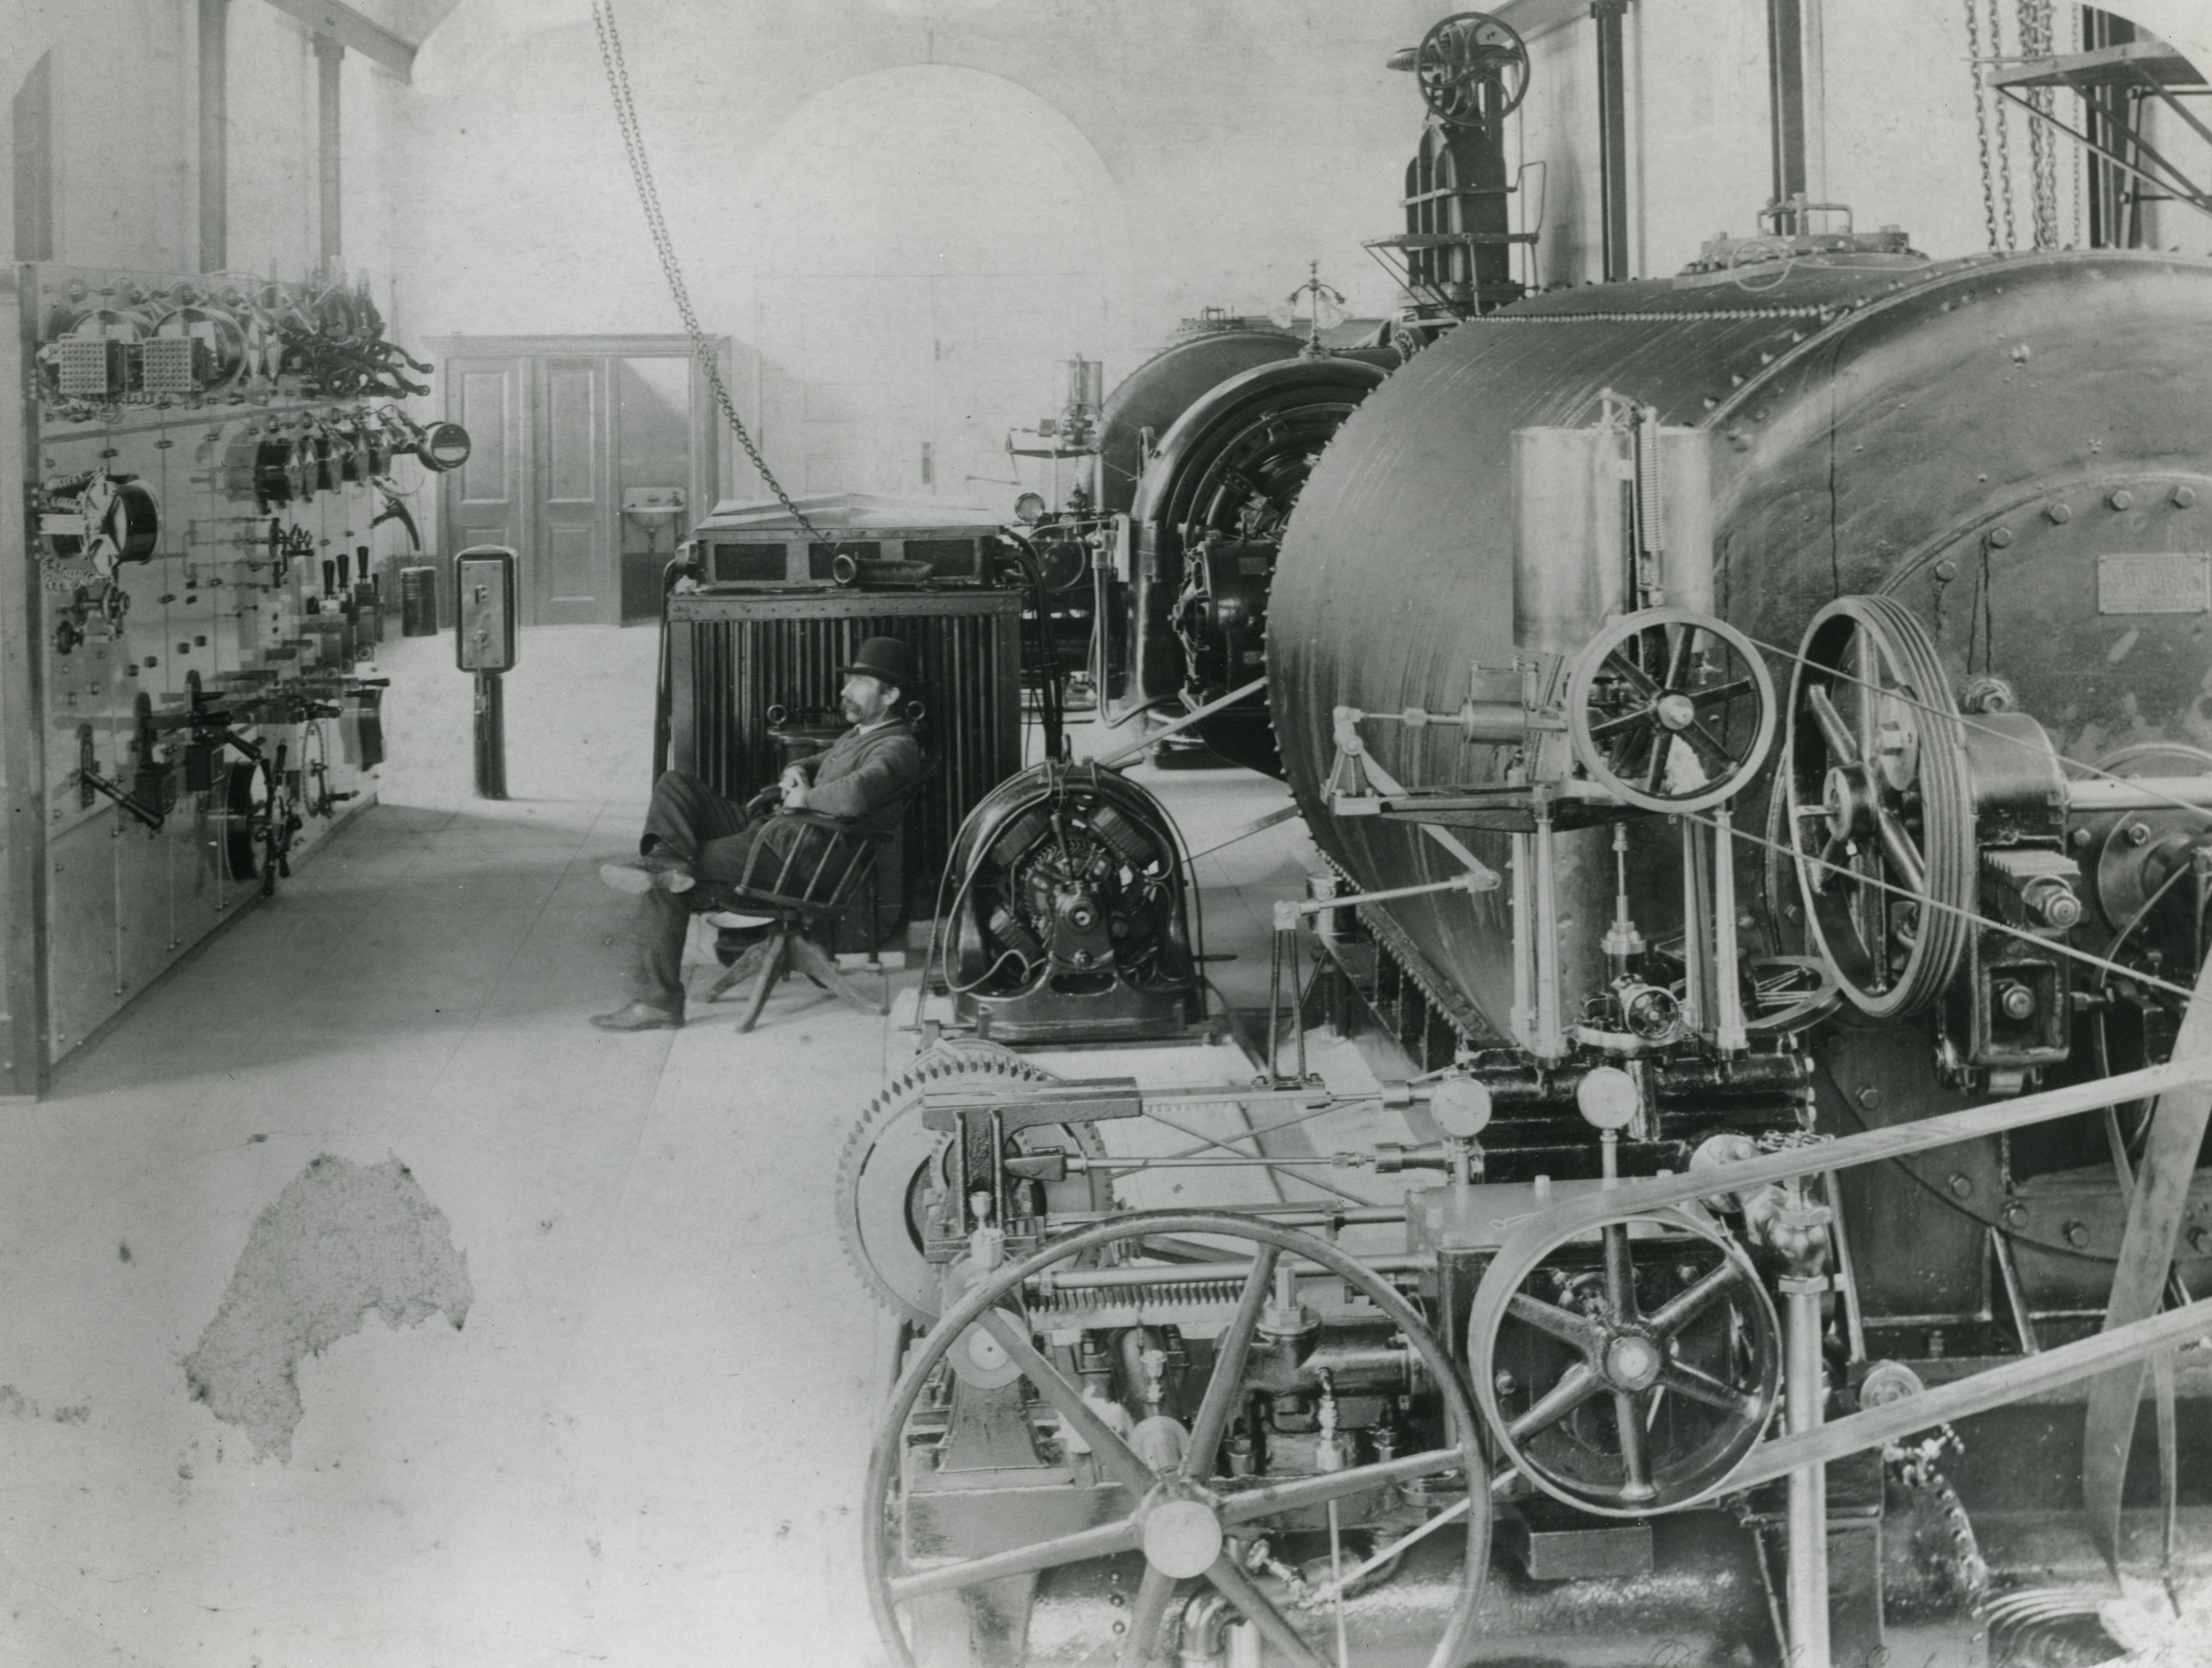
The dam went up starting in July 1900, when the Olympia Light & Power Company began work on the upper falls under engineer A.J. Gillis. The goal, in the language of the time, was to “harness the falls” for a bigger hydroelectric operation, replacing an older industrial setup on the middle falls that had produced something like 400 horsepower. The new dam and its flume cost around $13,000, real money in 1900, and by October the company had built stone walls and a flume ten feet square, a wooden pipe carrying three tons of water per foot across 700 feet to the powerhouse. That first structure raised the water level four to six feet above the natural bedrock, enough to back up a slack water pool for roughly a mile upstream. In 1903 the west wing got reinforced in concrete and masonry, built specifically to survive the river’s flood stages.

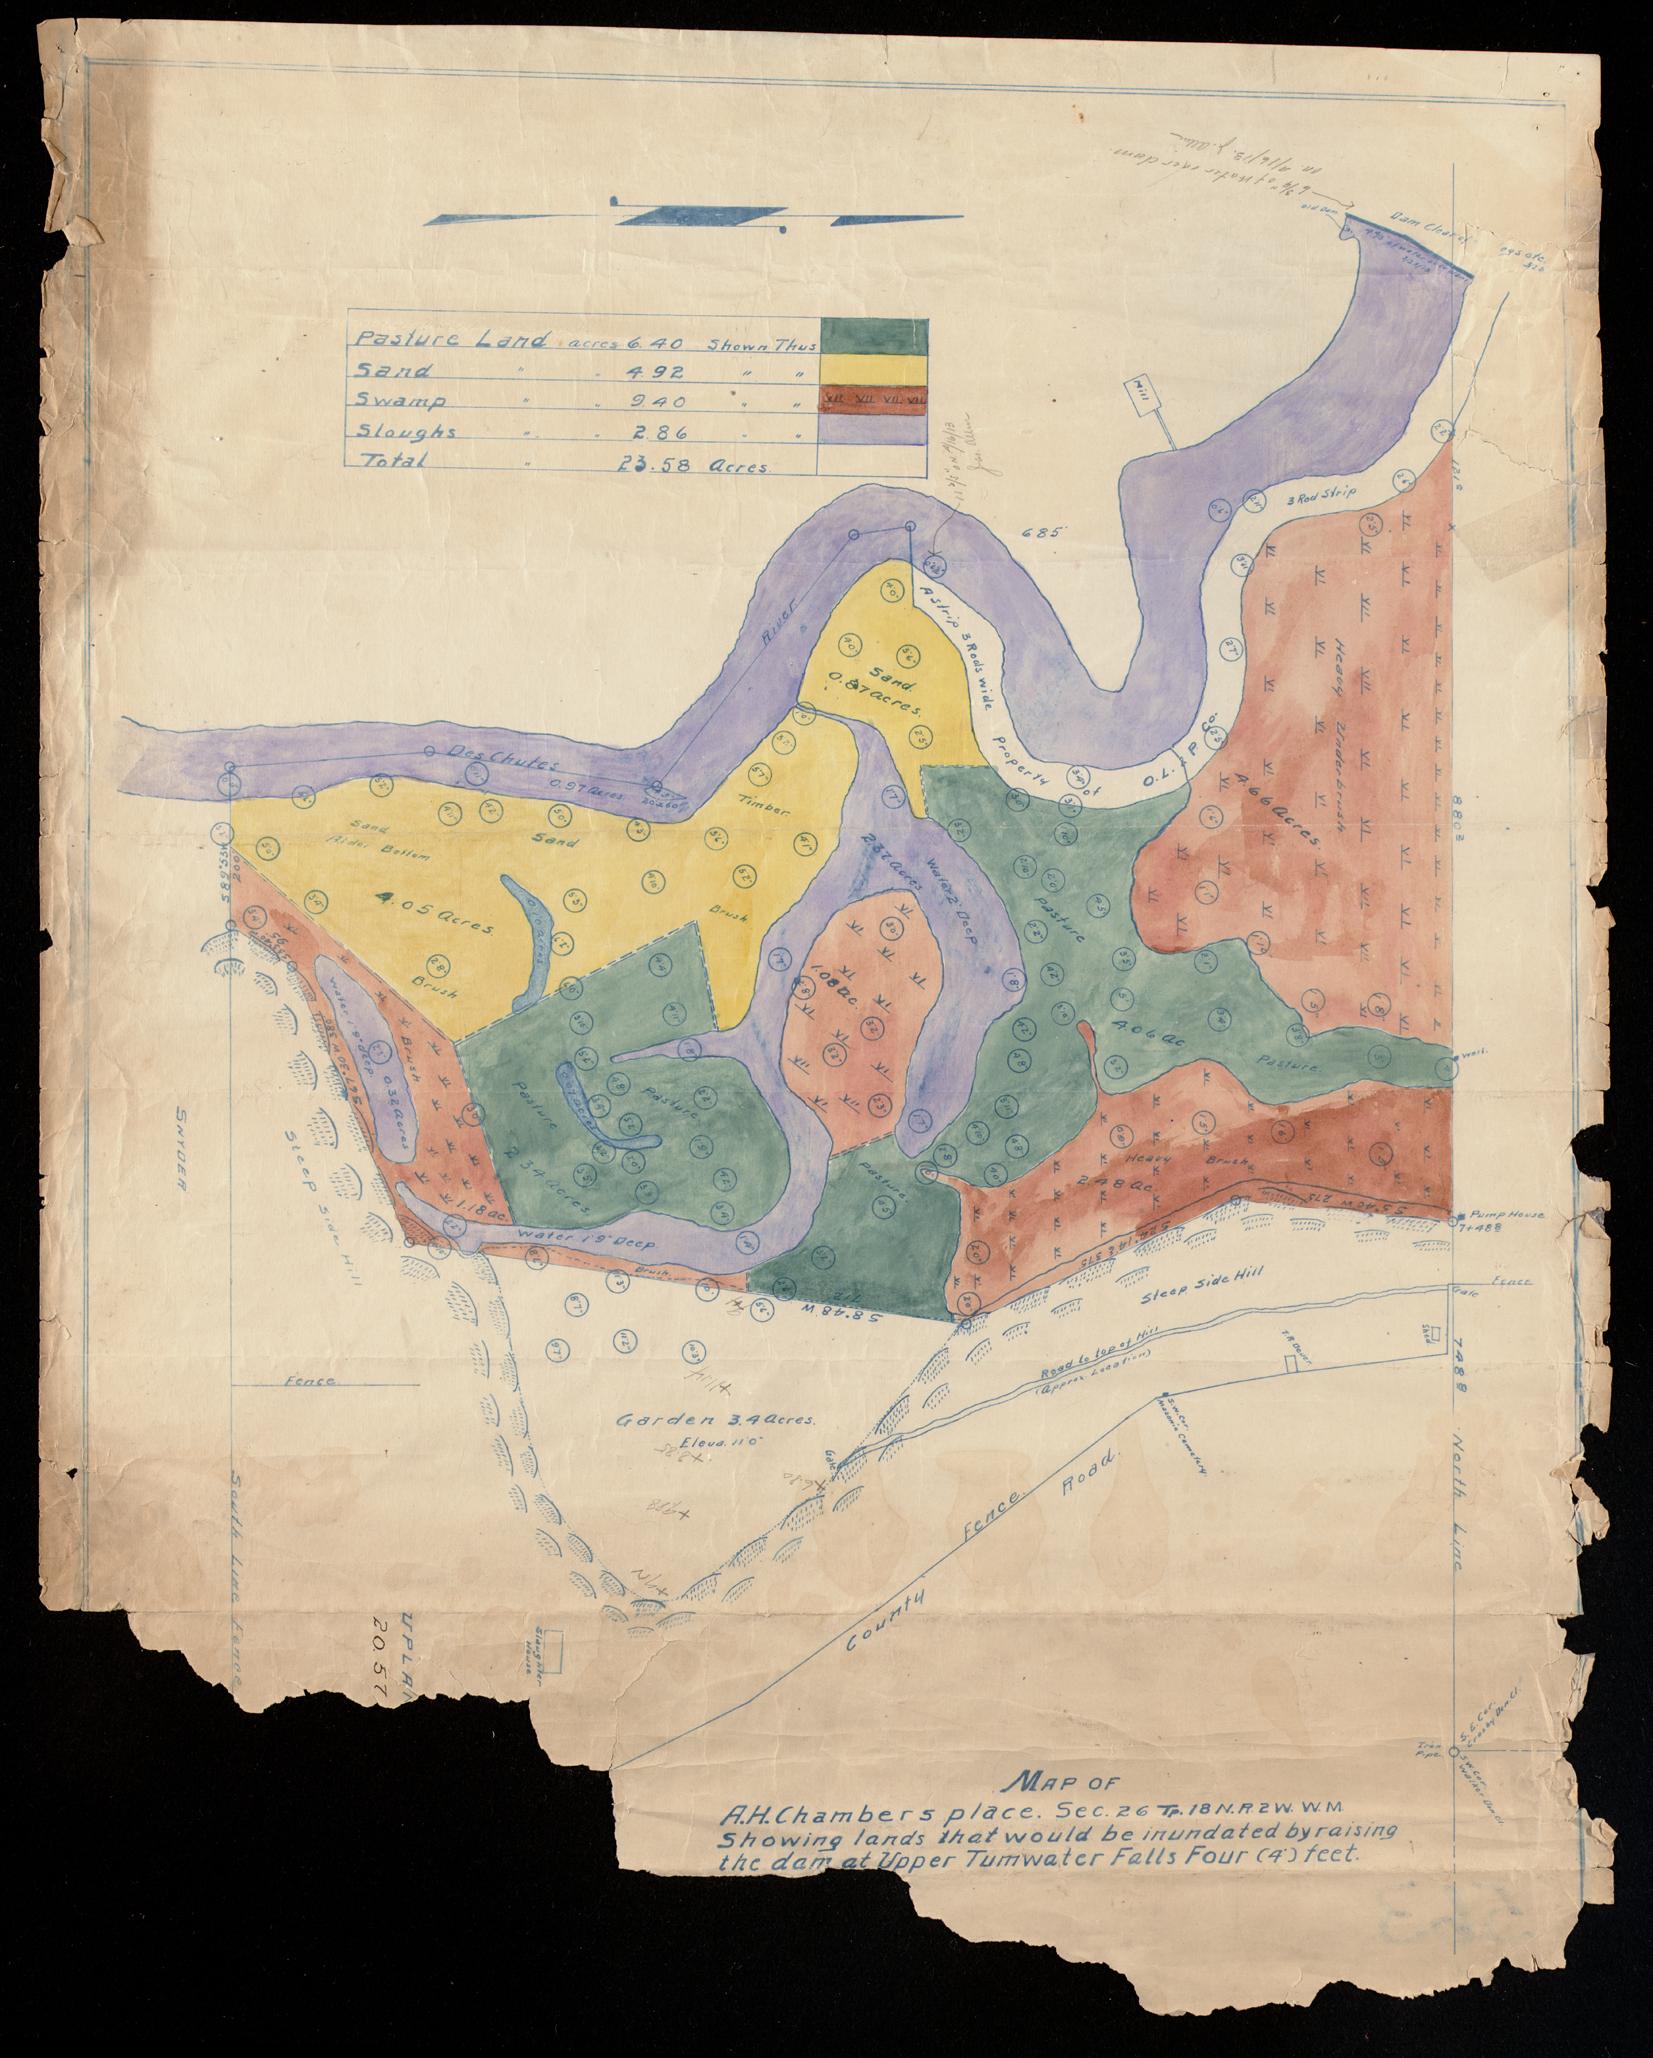
When the dam reached its full and current height, it inundated flat land that is now part of the Brewery Complex, but was then called the “Chambers Place.”
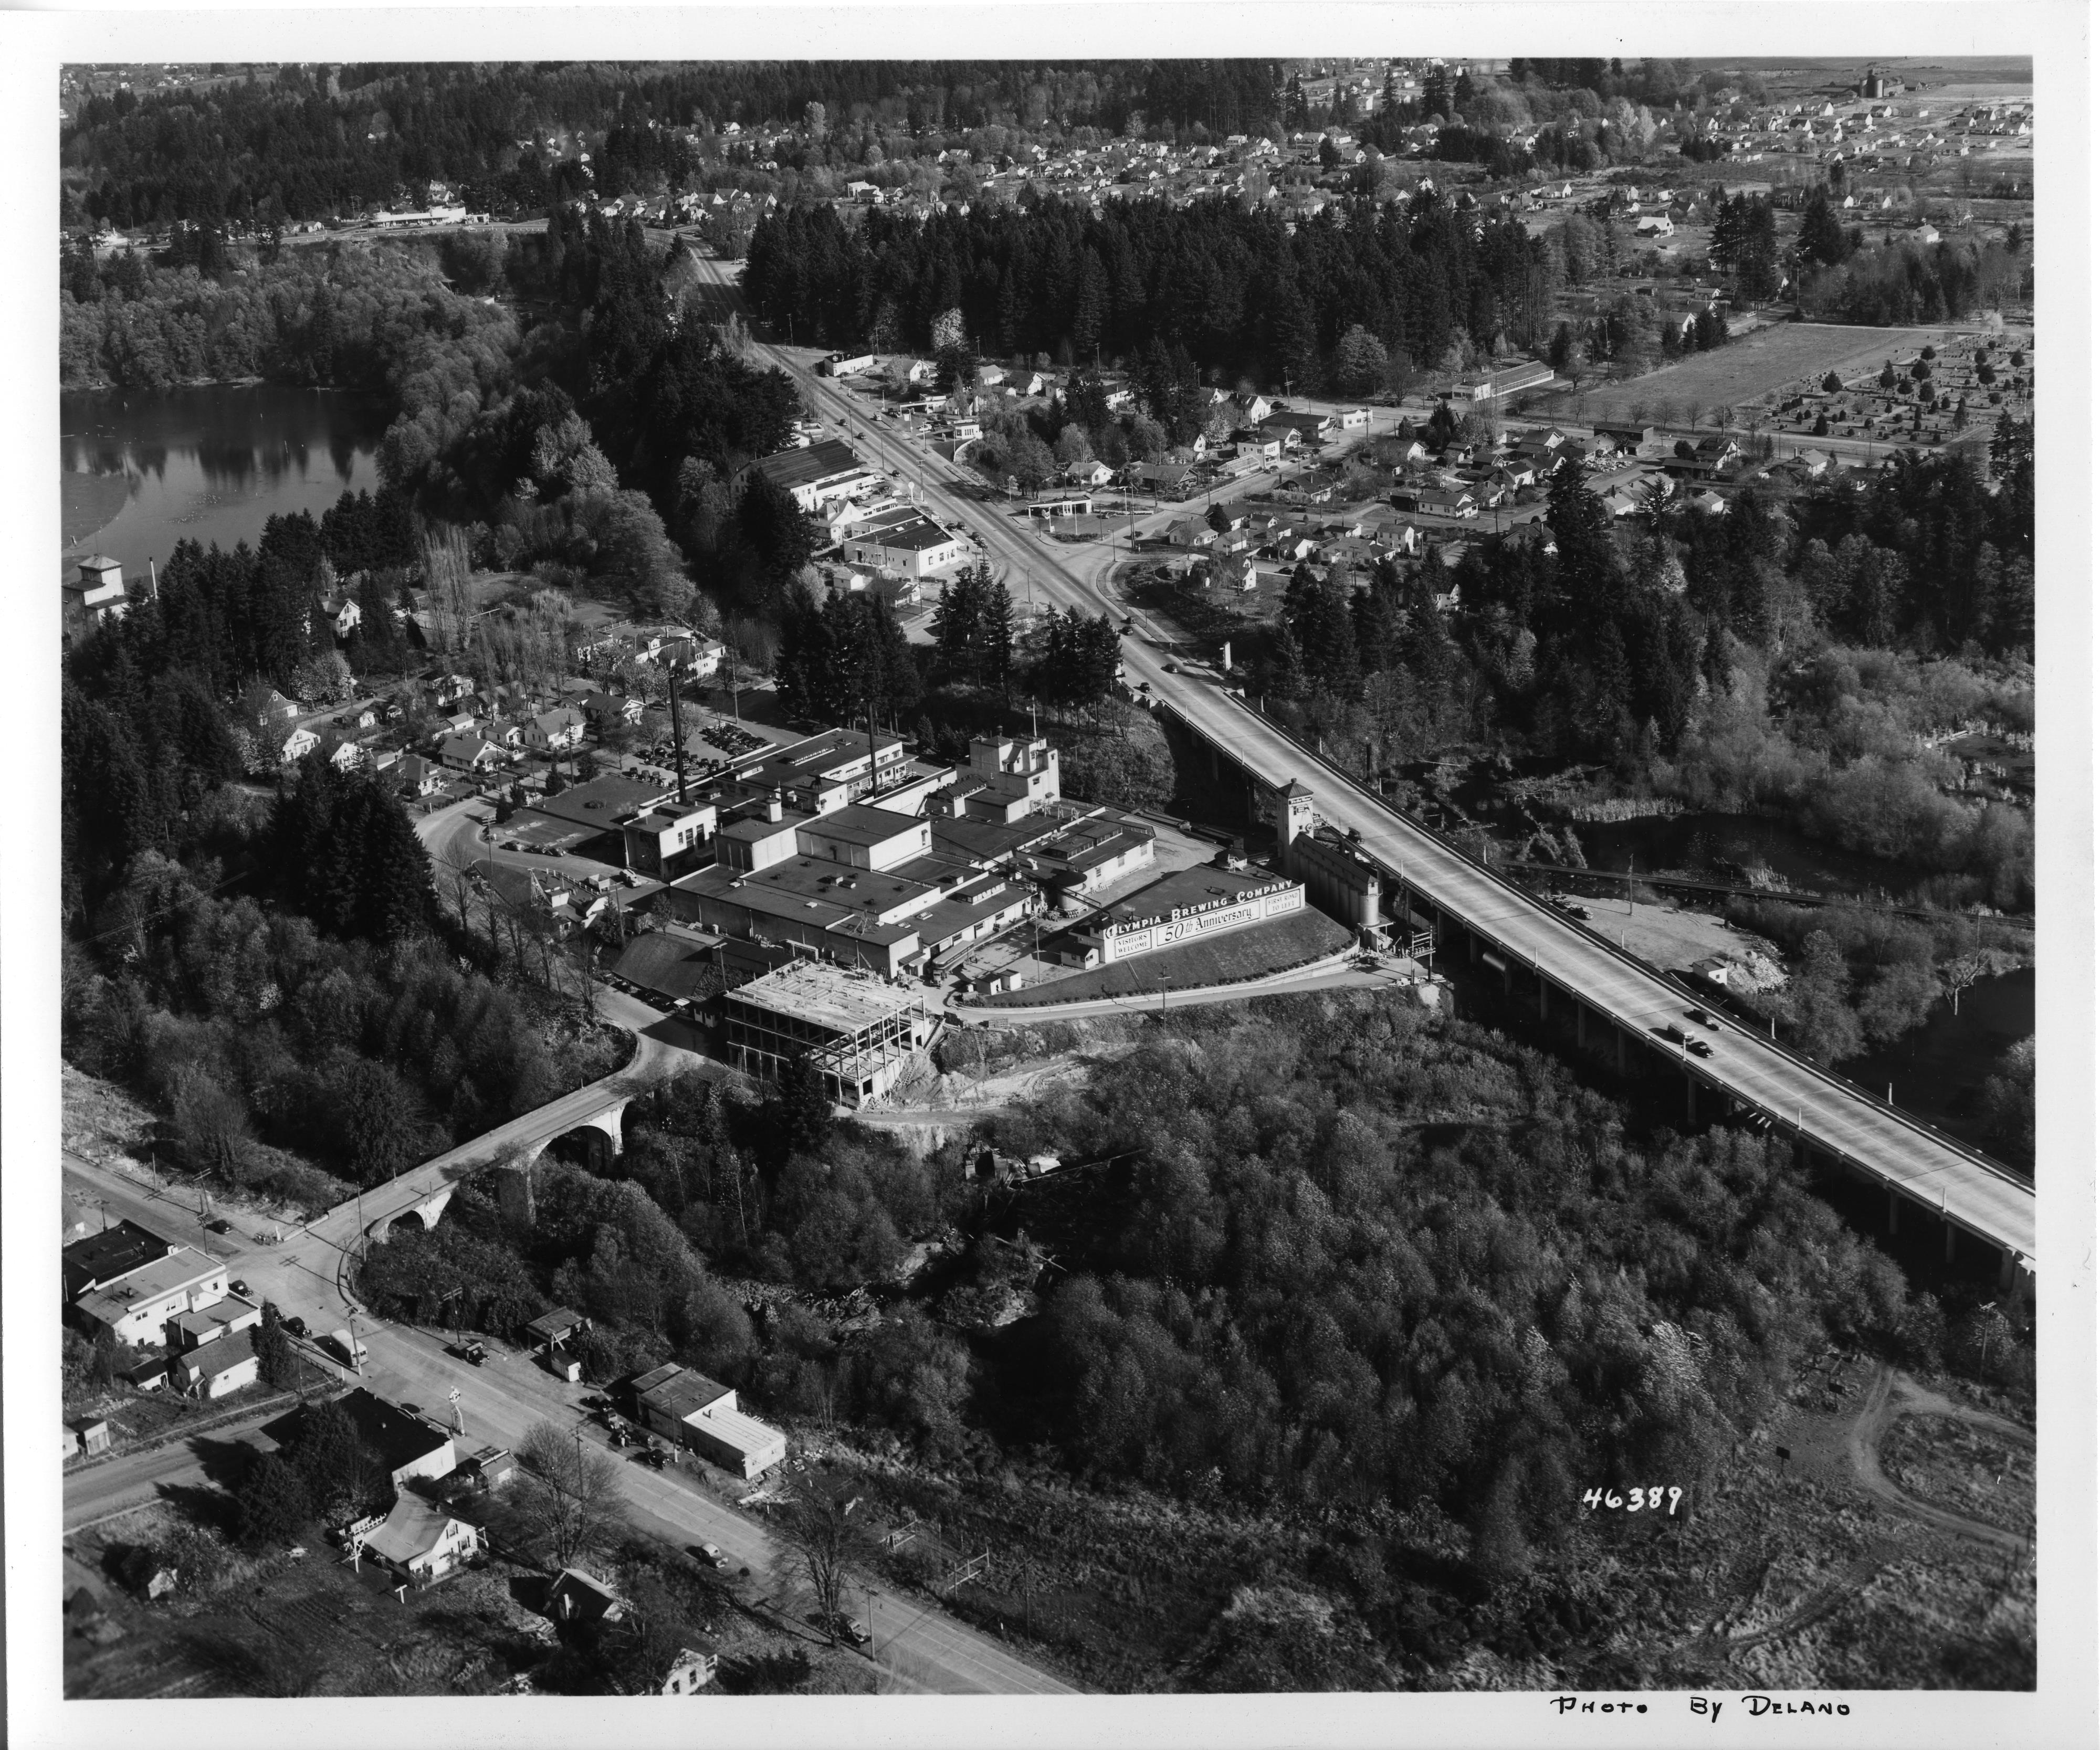
Then in 1905 things got contentious. The Olympia Brewing Company and the power company both had founding claims to the Deschutes, and a legal fight broke out over who actually controlled its flow. The brewery needed water too, and the power company was starting to realize that its dry-summer turbine problem wasn’t going away on its own.

That fight is old news, but you can still feel its outcome every time you step into the river in July.

Here’s how far the dam’s reach actually extends today. The pool it creates sits at roughly 85 feet above sea level, and the dam itself only accounts for four to six feet of that artificial rise over the natural bedrock lip.

My back-of-the-napkin math says the reason its effect travels so far upstream has nothing to do with the dam’s height and everything to do with the valley above it. Between the dam and Pioneer Park, the river drops only three to four feet per mile, remarkably flat for a stream that’s about to plunge 82 feet through a gorge. A gentle gradient means a small impoundment backs up a long way, and the standard backwater math for this stretch puts the slack water influence at roughly 0.8 to 1.2 miles upstream of the dam.

Walk that distance and you pass through three distinct stretches. From the dam to about 0.3 miles up, past the old brewery complex and under the E Street and I-5 bridges, the current in summer is close to nonexistent, more pond than river, narrow and deep and still. From 0.3 to 0.8 miles, along the lower edge of the golf course, it’s still noticeably slower than a free-flowing river, the kind of water where you drift instead of ride. Past that, from 0.8 to 1.2 miles, the backwater curve finally tapers off, the water gets shallow again, gravel bars reappear, and you start to feel actual current, riffles instead of glass.

This matters most in summer, which is exactly when people are in the water. The Deschutes’ natural flow drops during peak tubing season, low enough that the dam’s slack water effect dominates the entire lower mile of the run. Instead of a current carrying you toward the takeout, you get what amounts to a long bathtub, and tubers spend the last 4,000 feet or so paddling and pushing themselves along by hand. The dam that most people don’t know is there is the reason the last leg of their float feels like work.

The 1905 fight over water didn’t stay a courtroom skirmish. The power company’s problem was simple: the river ran low every summer, right when demand for electricity was climbing, and its solution was to treat Lake Lawrence, up in the watershed, as a kind of savings account. The plan called for a canal a mile and a quarter long, dug to divert winter floodwater into the lake, dammed at its outlet to hold that water back, then metered out over the summer to keep the Tumwater powerhouse running. It required flooding land the company didn’t own and diverting water the brewery believed it had rights to, so the fight dragged through the courts for years, what one account called a monkey wrench in the gears of the whole project. To get the land, the power company pursued eminent domain, arguing in court that because it supplied both electricity and streetcar service to the growing city of Olympia, it had the legal standing to condemn private and public land in the public interest. The argument worked. Lake Lawrence fell under company control, a 25-foot concrete dam rose at its outlet, and the diversion canal got finished. The following summer, with its water supply secured, the company rebuilt the Tumwater Falls dam itself, adding four feet of height and flooding another 30 acres of condemned land along the way. By 1914 the company had what it wanted: a stable, year-round power supply for a city growing at twice its historical rate.

It didn’t get to enjoy that win for long. In 1919, Puget Sound Power & Light bought Olympia Light & Power outright, and as regional transmission grids spread across the Pacific Northwest, a small local operation like the one at Tumwater Falls stopped making much sense. Generation was phased out gradually over the following years. The physical evidence held on longer than the business did. It wasn’t until 1962 that crews finally dismantled the stone powerhouse and the penstock below the falls, clearing the lower river corridor for what came next: the Olympia Tumwater Foundation’s Brewery Park at Tumwater Falls, opened in 1962 on the site of the old plant.

The power company’s old foe for control of the river, the Olympia Brewing Company, ended up owning the old dam site a few decades after the Puget Power sale.

Notice what got removed in that demolition and what didn’t. The powerhouse and the penstock, the parts of the complex that unmistakably read as industrial machinery, came down. The dam, the part that produces a waterfall people like to photograph, stayed exactly where it was. Whether or not that was the intent, the 1962 clearing erased the site’s industrial past and preserved its scenic present in one move.

And here’s a theory worth taking seriously: that clearing is probably what started the Deschutes’ recreational floating culture in the first place. The newspaper record doesn’t show organized river floating before the park existed. It shows up within less than a decade of Brewery Park opening, when a group called the Rough Riders started promoting floats down the Deschutes in the early 1970s. That timing reads like cause and effect more than coincidence. People don’t float for fun through a demolished industrial corridor with no public access and no destination. They float through a park with parking, a takeout, and a name.

The Rough Riders called floating “quite relaxing,” while warning newcomers about log jams and waterfalls, a warning that carried real weight given the still-recent memory of five people drowning after being swept over an unmarked falls sometime in the 1960s. They noted that a float from the East Olympia railroad bridge down to the brewery could take about eight hours during high spring flows. In June 1972, police searched for a group of missing juveniles and found them safe, floating on a raft near the brewery. By 1978 the activity had become fully organized, with the Deschutes River Float & Picnic drawing crowds for a run from the Henderson Boulevard bridge down to Tumwater Falls Park. The early 1980s brought a surge in inner tubing specifically, and with it came friction. A 1983 article described complaints from riverfront residents about trespassing and safety, and tubers who ran into trouble often ended up “bedraggled” on someone’s back lawn, looking for help. Thurston County considered putting up warning signs at the popular entry points.

In 1988, the city of Tumwater bought a stretch of pasture along Henderson Boulevard and built Pioneer Park. On paper it’s a sports and nature park, all ballfields and trails. In practice it became the unofficial starting line for the float, several miles downstream of the old East Olympia entry point, with enough parking to make the whole thing genuinely accessible for the first time. What it didn’t do was settle the question the dam raises a mile downstream. Pioneer Park sits at the edge of the slack water zone, near it or inside it depending on the flow that year and depending on exactly where within the park you put in. The 1988 purchase moved the uncertainty upstream rather than resolving it, handing the question to individual people choosing a launch spot, most of whom have no idea the choice even matters.

The dam itself is now well past a century old, built in phases between 1900 and 1913, a concrete gravity structure that at this age almost certainly carries no steel reinforcement inside it. Washington State classifies it as a Category 3, low hazard dam, meaning that if it failed, nobody’s life would be at risk and the resulting damage would be minor. That classification is its own quiet form of forgetting, a bureaucratic note that says this structure doesn’t need anyone’s attention. Structurally, though, it’s in better shape than its age suggests. Because it’s keyed directly into bedrock, it’s largely immune to the foundation scour that kills most aging dams during overtopping. Predating rebar reinforcement by decades, it’s also immune to the internal rusting and spalling that eventually destroys modern concrete. And our mild, wet climate spares it the freeze-thaw cycling that cracks concrete apart in harsher places.

It isn’t invulnerable. Vegetation works its way into old construction joints and slowly wedges them wider. Water percolating through the structure leaches calcium hydroxide out of the cement over time, weakening it. A century of silt has built up behind the dam, adding a steady load against the upstream face. None of that adds up to sudden failure. Left alone, this dam is likely good for another 100 to 200 years, wearing away slowly at its joints and spillways rather than going all at once.

I emailed the Olympia Tumwater Foundation to ask about the dam’s structural condition. That’s the organization that turned the demolished powerhouse site into a park in the first place, the one that, whether they meant to or not, decided sixty years ago which parts of this history would stay visible and which would get hauled away. They’re looking into what they might have and get back to me later. I’ll update this post if they have anything.

So the next time you’re standing in Falls Park facing that uppermost falls, know what you’re actually looking at.

It’s a dam built in 1900 to solve a hydroelectric company’s dry summer problem, expanded in 1913 after a legal war over a lake most people have never heard of, stripped of its machinery in 1962, and left standing, quietly, as the scenic backdrop for a park built on top of its own demolition.

The float culture that treats this river as a summer playground likely exists because that park got built, not despite the dam’s industrial history but because a foundation cleared away the parts of that history that looked too much like a factory. And the ambiguity never really left. Somebody launching a tube from Pioneer Park on an ordinary August afternoon has no way of knowing, without doing the math we just did, whether they’re floating on a free river or drifting through a captured pool behind a hundred-and-twenty-year-old dam. Most of them will never think to ask. The current under them, either way, carries the settled residue of a legal fight, a corporate merger, a demolition crew, and a social structure built on a slack pool and two parks.
Annexing the Future

For the first time in over fifty years, more people in Thurston County live inside a city than outside one. It could be an urbanist success story, zoning reform finally winning out, transit investment tipping the scale toward density. It isn’t. The real story’s older, weirder, and a lot less democratic. Once you see how it happened, I think it’s still worth calling out the right outcome.

This is the post I’m writing about the 2026 release of population estimates by OFM. Every year, the agency releases estimates as a guide for state spending. These estimates also give a picture of the changing shape of our communities.

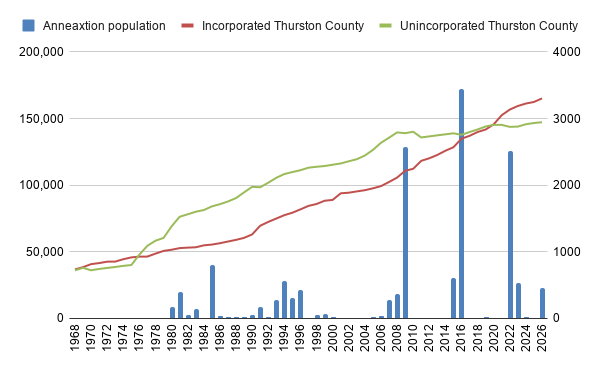
You can see the lines cross in the 1970s and in 2020. The blue bars are the population captured by annexation, and is on the right hand axis, not the left.

This year’s data shows that between 1976 and 2020, unincorporated Thurston County outnumbered the incorporated cities every single year, a run that held for four and a half decades before it broke in the space of six. The trend started in 1976 because the late 70s saw two record years (in both percentage and raw numbers) of massive in-migration, most of which apparently ended up outside the cities.

But, that trend has finally started to shift But, if this were really about people choosing city life, you’d expect a gradual climb, year over year. Folks being priced out of car dependence drifting toward Olympia, Lacey, and Tumwater one household at a time. That’s not what the numbers show. Instead you get a flat unincorporated population since 2008, a 5,000-person drop in one bizarre year, and then a string of specific years where the incorporated population jumps by two or three thousand people all at once. 2009. 2016. 2022.

Those aren’t migrations, they’re annexations.

Before 2009, annexation in Thurston County was small and constant. Cities picked up a parcel here and a parcel there, mostly empty land, occasionally a few dozen or a few hundred people riding along with it. Lacey, Olympia, Tumwater, and Yelm all added pieces most years, rarely anything anyone would call a headline. Lacey’s 1985 annexation brought in nearly 800 residents. Olympia added just over 180 in 1995. These were rounding errors against the county’s total population, just the ordinary housekeeping of city boundaries.

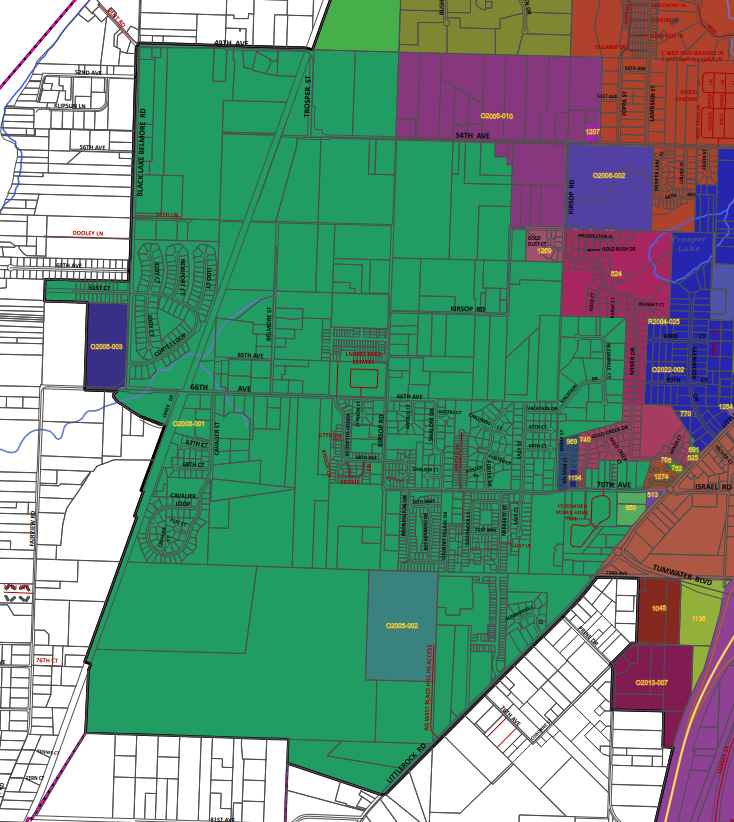
Then the housekeeping stopped and the big grabs started. Tumwater’s annexation, effective February 2008, brought in 2,553 residents in one motion. We’re going to focus on this particular annexation. In my memory, it felt like an existential change for Tumwater, we expected at the time a massive shift in population, that may have happened slower than we expected, given the housing crash a few years later.

Olympia added 562 people in June 2014, a smaller jump but still a departure for a city that usually moved in small numbers. Tumwater came back in January 2016 with the largest single annexation of the last fifteen years, 3,255 residents absorbed in one stroke. Lacey had its turn in 2021, running two separate annexations between May and September that added 1,535 and 978 residents, over 2,500 combined in a single year. Tumwater kept at it into 2022, a dozen smaller annexations in May plus a 332-resident addition in June, while Lacey added close to 100 more that spring. Lacey’s doing it again, with a March 2025 annexation projected to add 455 residents.

Cities were working through a handful of legal tools, deciding case by case and year by year when to catch up with development that had already happened around them. You see a pattern that has nothing to do with a slow cultural shift toward city living.

The old way: leverage, not consent

For most of Thurston County’s modern annexation history, the tool of choice was the Sixty Percent Petition Method. It let property owners representing 60 percent of a target area’s assessed value petition their way into a city on their own. Notice what’s doing the work in that sentence. Not 60 percent of residents. Sixty percent of assessed value. A handful of large landowners, sometimes just one or two big parcels, could decide the governmental future of everyone else living on that land, tenants included.

Where the petition method wasn’t quite enough on its own, cities reached for something even quieter: the “no-protest” utility agreement. Sign one of these to get city water or sewer, and you’d also signed away your right to fight annexation whenever the city decided to come collect.

This is coercive by design, and the state’s own Supreme Court flinched at it once. In 2002, Grant County Fire Protection District No. 5 v. City of Moses Lake found that bypassing a general vote of residents violated the state constitution. For a minute, it looked like the petition method might be finished. The court walked the ruling back not long after, and cities kept using the tool. Tumwater’s biggest annexation wave, the one that added 3,255 residents in a single stroke in 2016, happened well within this post-2002, still-contested legal window.

The fight nobody outside city hall saw

The clearest look at how contested this actually was comes from Tumwater’s 2007 annexation, 1,620 acres that went before the Thurston County Boundary Review Board on a narrow 3-2 vote. The board was one vote from saying no. What flipped it was a last-minute fire service agreement between Tumwater and the Black Lake Fire District, which stood to lose a third of its operating budget once the annexed area stopped paying into it. One dissenting board member called the deal a “shotgun marriage.” He wasn’t wrong. There are real political realities in swapping land between cities and the county, between special districts and city agencies. But, the decline of a rural special district and agreements based on you getting city water are not bad things.

Why the leverage was still the right call

Here’s where I land, and I think it’s a harder position than just cheering for density. The land inside that 1,620-acre annexation wasn’t all farmland waiting to be paved. It was already suburban, already built at a density and a distance from city boundaries  that made a rural fire district and a county road department a worse fit for it than a city government with sewer lines already running past the property. The petition method and the utility agreements were ugly tools, built to let city and landowners jump the line without asking anyone’s permission. But the outcome they produced, in this case, matched governance to a landscape that had already been built. That’s not nothing. A fire district’s claim to keep serving an area doesn’t automatically outrank the question of who can actually do the job better once that area looks and functions like a city. If a city can run water, sewer, fire protection, and roads to a piece of land more efficiently than the county patchwork that grew up around it by accident, the district losing its slice of that territory isn’t an injustice. It’s a service boundary catching up to reality a few decades late.

That’s a different claim than “annexation is democratic,” which it mostly wasn’t. It’s a claim that the state spent thirty years building an escape hatch, that city services should follow city-level density, and that the escape hatch got used, however roughly, to reach that outcome.

The state noticed too

The more interesting shift, and the one I think will matter more going forward, is that leverage isn’t the only tool anymore. After 2002, the state built the Alternative Petition Method, which requires signatures from a majority of both property owners and registered voters, a real check the old method never had. Then came the Interlocal Agreement pathways, letting cities negotiate directly with counties over revenue sharing and infrastructure before annexing anything. In 2023 the legislature revived a sales tax credit specifically to pay cities for absorbing unincorporated growth areas over 2,000 people. 

Boundary Review Boards are disappearing too. Spokane disbanded its board in 2012. Lewis County did the same as recently as 2026. The fights those boards used to referee are increasingly handled through negotiation instead of a contested vote.

Right around the time the old, coercive tools had already finished most of the job, the state built better ones.

What I can’t prove yet

I’d like to end this by telling you that all of this points toward a walkable, mixed-use future for Thurston County’s cities, third places and multimodal streets slowly replacing the cul-de-sacs that got annexed. 

I can’t actually back that up. 

Annexation moves a jurisdictional line, nothing else. It doesn’t retrofit a sidewalk or rezone a strip mall. Everything in this record shows governance catching up to sprawl, not sprawl getting undone. The most honest thing I can say is that Thurston County’s cities now have the tools, and increasingly the financial incentive, to govern the suburban land they’ve absorbed. What they choose to do with that authority, whether it produces the kind of denser, more human-scaled development that we  want, is still an open question. That part is hope, not history.

Why the Myth of Tumwater and Interstate 5 Matters

David Scherer Water is a treasure; there is no question about that.

But I take exception to his recent piece on Interstate 5 and our community, specifically how he frames the highway’s impact on Tumwater. David leans on the familiar “Interstate 5 destroyed Tumwater’s downtown” narrative.

David and I both explore the highway’s impact on Tumwater and Olympia, but our conclusions diverge sharply. Where David frames I-5 as a transformative and destructive force, I argue that Tumwater’s decline predates the interstate, shaped by earlier infrastructure decisions and geographic shifts.

David portrays I-5 as the villain: a “highway that destroyed Tumwater” and created Lacey, altering traffic patterns and dooming downtown Olympia. He emphasizes the dramatic, almost cinematic effect of concrete and asphalt cutting through established communities.

In contrast, my analysis situates I-5 as one of many forces affecting Tumwater. The town’s commercial decline had already begun with the construction of Capitol Way in 1938, which bypassed the original downtown area and redirected commercial activity to new locations. By the time I-5 arrived, the downtown core was largely abandoned, not obliterated by the highway. In my view, I-5 is less a destroyer than a marker of trends already in motion.

These distinctions matter. Before diving deeper, it’s worth noting that David and I already plan to take a walk together to discuss our differing approaches. We’ll record the conversation, which will appear in a future episode of The Olympia Standard podcast.

So why does this myth endure? Why does it matter to understand what really happened?

1. Understanding the impact of car culture on Thurston County

Interstate 5 was hugely significant. Aside from the 1950s Lemon case, which forced the state to relocate offices back to Olympia, I-5 was probably the most consequential development in our community since colonization. Lacey likely wouldn’t exist as a city, and Tumwater may not have grown as large without it. More broadly, the question of how car culture shaped our cities remains unresolved. A nuanced understanding of I-5’s impact is crucial for comprehending the complete story of regional development.

2. Robert Moses vs. Jane Jacobs

Urban planning scholars often frame debates through the Jacobs-versus-Moses lens. David casts the highway as a transformative, almost destructive force, emphasizing the top-down power of planners and officials to remake (or bury) downtowns, much like Robert Moses reshaped New York at the expense of neighborhoods.

Even though no Robert Moses operated in Thurston County, our debate mirrors this classic frame. David emphasizes centralized, dramatic change; I emphasize organic, context-driven shifts. The contrast highlights the tension between imposing grand designs and respecting the lived realities of communities.

3. Misunderstanding Tumwater in 1950

Tumwater did double in population between 1940 and 1950, but context is key. The town had fewer than 1,000 residents in 1940, roughly comparable to Rainier in 1990. By 1950, it had over 2,000 residents, more than doubling in size. This wasn’t due to increased density; Tumwater grew by sprawl, much like Rainier today. During the 1940s, the town was engaged in annexation disputes with Olympia over the Carlyon neighborhood and was building its first subdivisions south of Trosper Road.

4. Imagining what could have been

Tumwater today is spread across multiple nodes, with disconnected districts, much of its footprint suburban and car-centered. Unlike Olympia, Elma, or Shelton, it lacks a traditional “town” feel. Yet the idea that Tumwater once had a central, walkable downtown lingers in our imaginations.

We think of Issaquah and its salmon hatchery integrated into the civic landscape. Or we think of Steilacoom’s hillside rooftop dining, or Shelton’s cozy, somewhat forward-moving downtown. These towns were all bypassed by highways, but most had significant downtown cores before the interstates arrived. Lacey, by contrast, may have had a small commercial strip before I-5, but no one ever called that “downtown Lacey.”

The myth that I-5 single-handedly destroyed Tumwater obscures these deeper structural and historical realities. Understanding the nuances doesn’t diminish the highway’s significance; it helps us appreciate how communities evolve and the choices that shape them.

2025 Population Trends: Coastal Decline, Rural Migration, and Growing Thurston Density

One of my favorite weeks of the year comes at the end of June, when the Washington State Office of Financial Management releases its annual population estimates. This data dives deep into how cities and counties across the state are changing, whether through natural growth (births minus deaths) or migration.

It’s a treasure trove of information that offers valuable insight into how our communities and regions are evolving. Here are a few takeaways I’ve gleaned from this year’s release:

1. The death churn continues.

Over the past few years, I’ve noticed a growing trend in county-level data: many areas are now experiencing negative natural growth. That is, more people are dying than being born. I visualized this by zooming out and color-coding the data, Clallam County stands out as a long red line, while King and Pierce counties show up as long blue lines.

As time goes on, more counties are trending red. This doesn’t necessarily mean these counties are shrinking in total population (in-migration often makes up the difference). Still, it does show the demographic impacts of an aging population, particularly as the boomer generation continues to age.

Interestingly, this shift in natural growth isn’t uniform across the state. When I mapped the past few years of data, a pattern emerged: rural coastal counties like Clallam are at the center of this trend, while areas like Puget Sound and parts of Central Washington show different dynamics.

2. Migration offsets the death churn.

I also plotted natural growth against net migration since 2020 and found a clear inverse relationship: the more deaths outpace births, the more in-migration tends to make up for the gap.

And despite King County’s reputation as a hub for newcomers, it’s not actually the most migration-heavy area on a per capita basis. That distinction goes to counties like Pend Oreille, Columbia, and Pacific, all of which are seeing negative natural growth.

It raises a deeper question: Are these new arrivals older, potentially exacerbating the natural growth decline? There’s more to explore in this data in future posts.

3. Thurston County: Lacey outpaces Olympia (again).

Shifting focus to Thurston County, the trend of Lacey growing faster than Olympia continues. Lacey remains the largest city in the county, with over 60,000 residents compared to Olympia’s 57,000.

Looking at data from the Thurston Regional Planning Council, the reason is clear: annexation.

Since 2020, Olympia hasn’t annexed any new land, while Lacey has added more than 1,100 acres.

This expansion impacts population density. Although Lacey is still slightly more dense than Olympia, its density fluctuates year to year. Meanwhile, Olympia’s density has increased steadily.

4. Tumwater and Yelm: Expanding outward.

Speaking of annexations, Tumwater and Yelm have also been aggressive in expanding their boundaries.

Since 1979, Tumwater has annexed over 7,000 acres, about the same as Lacey, and far more than Olympia’s 2,200 acres. Yelm, despite its smaller size, has annexed more than 3,000 acres.

This means that, physically, Tumwater and Yelm cover far more land than their populations might suggest. If Tumwater had the same population density as Olympia or Lacey, it would have between 55,000 and 57,000 residents. Yelm, too, would be much larger, north of 17,000 residents.

These shifting patterns of growth, migration, aging, and expansion paint a complex and fascinating picture of how Washington is changing, county by county, city by city. There’s a lot more to unpack, and I’ll keep digging into it in future posts.

Why did denser neighborhoods vote for the Regional Fire Authority?

Yesterday, the detailed precinct-by-precinct data for the recent April 25 election was released, and a certain trend became evident when I mapped out the results. This exercise serves as an essential reminder that even so-called “blowout” elections can have nuances that are crucial to comprehend if we aim to understand our community.

Here are the straightforward results by precinct (and the data I used):

What I see here is fairly straightforward. Downtown Olympia, the apartment complexes on the west and far east sides of Olympia, and likely Tumwater’s most densely populated neighborhoods along Tumwater Hill, all voted in favor of the Regional Fire Authority. On the other hand, the nearby westside and southeast Olympia led the vote against the RFA.

When comparing the approval rates for the public art election last April to the RFA this spring on a map of Olympia (excluding downtown), the same pattern emerges. The far eastside and westside apartment precincts were the only areas in town where the RFA received more votes than the public art proposition.

The turnout maps for the April 2023 vote present a somewhat mixed bag at first glance. On this map, I noticed the high-density neighborhoods that voted for the RFA are represented on both sides of the turnout scale. However, the less dense neighborhoods tend to appear on the higher turnout side.


The pattern becomes even more apparent when focusing solely on the Olympia precincts that took part in the art proposition. In the map below, precincts that turned out more for art last year are depicted in blue, while those that turned out more for fire are in red.

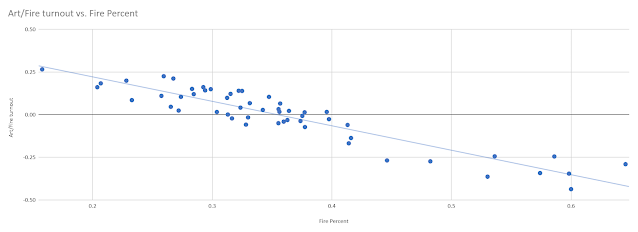
These maps reveal an interesting pattern. In general, precincts that turned out more in favor of the RFA (versus art) tended to vote more in favor of the RFA. This conclusion is supported by the chart below, which demonstrates this trend quite clearly:

Essentially, the precincts that voted against the RFA likely did so because of a general lack of turnout. In those precincts, people may have returned a ballot for the arts, but chose to hold onto their ballots for the fire vote. 

Additionally, I want to revisit the topic of how apartment dwellers voted, as it relates to the messaging of the “Save our Fire Departments” (or No on Prop 1) campaign. The opponents of the RFA highlighted the higher costs that apartment dwellers would pay under the proposed formula to finance the RFA. However, this argument seems to have fallen on deaf ears, possibly due to where the No campaign focused its outreach. It’s worth noting that this argument didn’t resonate with its intended audience, as evidenced by the approval and turnout maps.
Okay, but really, why?
I’ve seen general observations that apartment dwellers fear fire more than people who live in single family homes. And that makes inherent sense, I suppose. But I haven’t found any polling or research that backs this assumption up.

Interstate 5 did not destroy Tumwater’s downtown. It was already dead. Killed by isolation

One of the most persistent Olympia-area history myths is that Interstate 5 destroyed Tumwater’s downtown. I’ve written about this before, so what follows you can find in different forms in other places, but I tidied it up for this post.

Daisy Ackley in her “Wagon Wheel’s A’Rolling” history tells what has become common knowledge in our area, the interstate came careening through town and destroyed what was Tumwater.

Poor old Tumwater. There is nothing left of the original town, save the name. It has been drawn and quartered (as it were), but the “Freeway” running through it from “stem to gudgeon.” None of the old landmarks on Main Street (now Deschutes Way) are left.

Let’s take a step back and explore Tumwater’s history through its roads. Interstate 5 wasn’t the first road to change the course of Tumwater’s history. It is possible to tell the story of the town through its roads and railroads.

The Olympia Tenino/Port Townsend Southern Railroad (1875) and the Olympia Terminal/Union Pacific (1915) and the transition between the two show how roads changed Tumwater and how they changed the focus of Tumwater.

The Port Townsend line ran through the old river focussed Tumwater, connecting its industries directly along the lower Deschutes estuary to the saltwater on the shores of West Olympia.

The Union Pacific line (while it did connect through a branch down to the old Olympia brewery site then on saltwater) is certainly new Tumwater. And, through ownership changes in the early 1900s, both lines became owned by the same company (Union Pacific) and the latter replaced the former in connecting Tumwater to the Olympia waterfront.

In geography, here’s the difference between the two lines. The Port Townsend line ran through the west side of what is now the Tumwater Falls Park. Much of the current trail is actually the old railroad grade. It continued down the west side of the Deschutes River (now Capitol Lake) until reaching saltwater near where Tugboat Annie’s is now.

While the Port Townsend Line sunset in 1916, the Union Pacific (former Olympia Terminal Line) was being completed just a year earlier. This is the current line when you think of the Olympia Brewery. Going down Custer Way, this is the line you cross over. The one obstacle that the road had to face to get from up on the east bluff to downtown Olympia and the waterfront was the bluff itself. The solution was a tunnel under Capitol Boulevard.

What’s interesting to me is that while the new railroad, the railroad that started drawing Tumwater up and away from the river, seems so tiny compared to I-5. While tunneling under Capitol Way created a nice shortcut for the railroad, it pales in comparison to the obliteration of the same hillside by I-5 just decades later.

And that move, away from the industry of the river in the early 1900s, was the most vital step. It shows that Tumwater as a community was already moving away from what people claim as the city’s “downtown” well before the interstate.

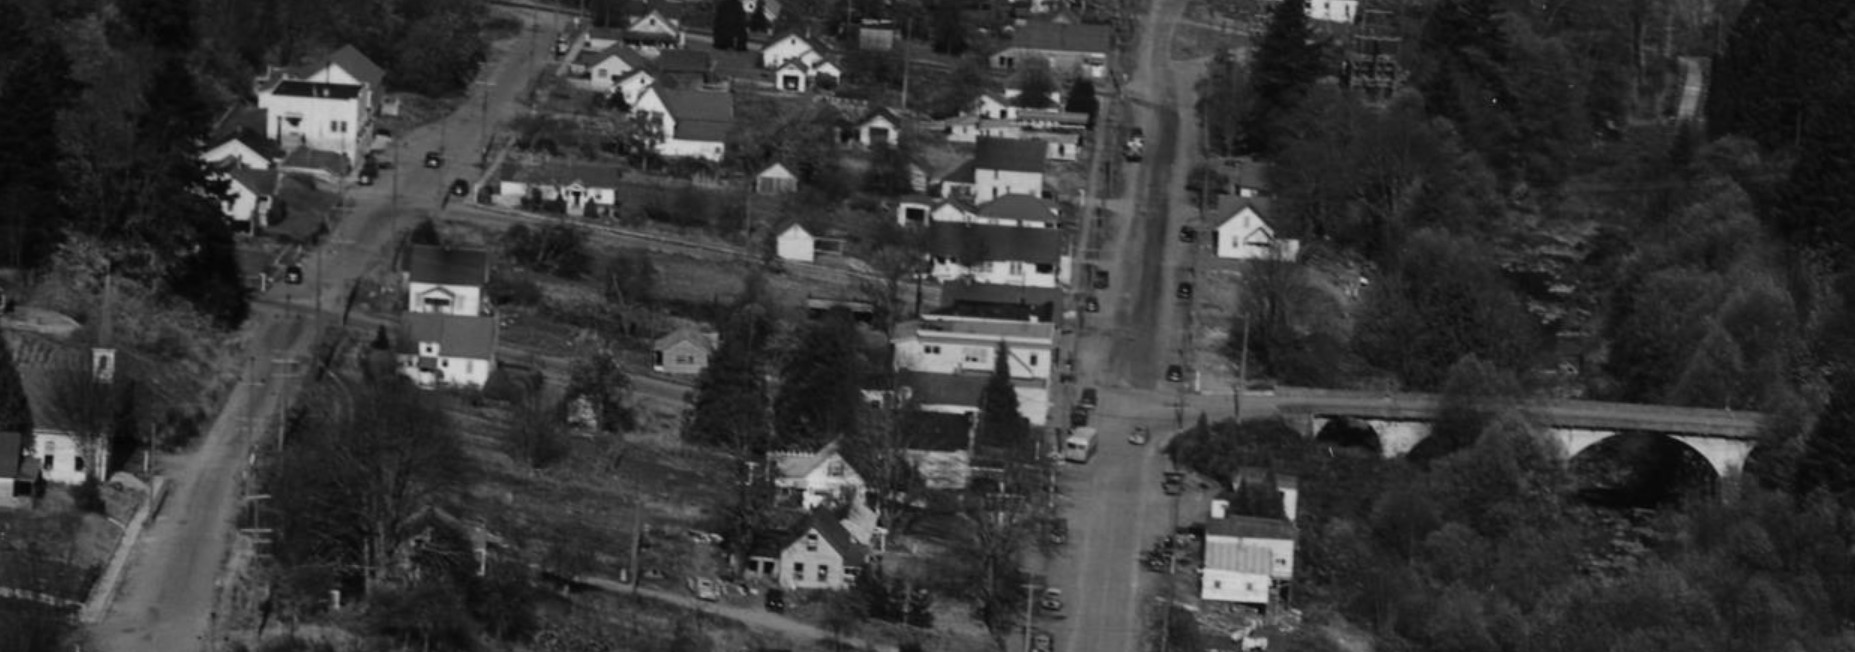
This is “downtown Tumwater” as it existed in 1946 (detail from this photo at the Washington State Archives):

While I-5 may have come along later to bury Tumwater’s historic downtown, by the time it got there, Capitol Way had already stuck the knife in.

The best history of this, actually what got me started on this entire line of thinking, is Shanna Stevenson’s chapter “A Freeway Runs Through It” in “The River Remembers.” She points out that before 1936 the main drag through Tumwater dog-legged through the old downtown Tumwater.

After the current Capitol Way was finished in 1938, it totally bypassed the old downtown. This bypass led to the creation of the commercial area down at Capitol Way and Trosper Road.

Going from crossing the Deschutes on a low bridge over waterfalls, the main road through Tumwater now crossed the Deschutes at a much wider point (a more than 1,000 foot span) over what is now the old (but then new) Tumwater brewery.

For over a decade before Interstate 5 uprooted the blocks old downtown Tumwater, the city was already abandoning its water-falls based history and moving east and south.

Even compared to the current downtown Olympia, “downtown” (and that is a real stretch to call it that) Tumwater in the early 1950s was isolated and not a thriving business district.

And the kicker is that the Tumwater City council signed onto the plan:

By 1951 a route for the future I-5 was selected which would have separated the state Capitol from downtown Olympia via an underground viaduct along Tenth Avenue. It would have crossed Capitol Lake near the Burlington Northern Santa Fe (BNSF) railroad trestle and traveled up the Percival Creek canyon into West Olympia. A spur road to the west was to be located near the head of the creek, and would have provided access to Shelton and Aberdeen.

However, in 1954 cost estimates for the Tenth Avenue route caused highway engineers to seek an alternative alignment. The Tumwater Canyon, with its basalt bedrock, was proposed as an alternative. The Tumwater Canyon alternative would virtually wipe out the original central business district of Tumwater, cross Capitol Lake in a wide curve, and cut under Capitol Way at 27th Avenue.

Another alternative route, called the Dunham bypass, would have by-passed both downtown Olympia and Tumwater to cross near Ward Lake. …In April 1954, after much discussion, both the Olympia and Tumwater city councils signed onto the Tumwater Canyon alternative.

If I-5 did kill any part of Tumwater, Tumwater let it happen. And at any rate, Tumwater’s actual commercial districts had already moved on.

Why downtown Olympia is more productive than the growing edge of Olympia (or Lacey or Tumwater)

Why would you want other parts of Thurston County (Lacey, westside Olympia and Tumwater) to become more like downtown Olympia? Because it is more valuable. Way more valuable.

Take two blocks, one nondescript block in downtown Olympia and another out in the westside.

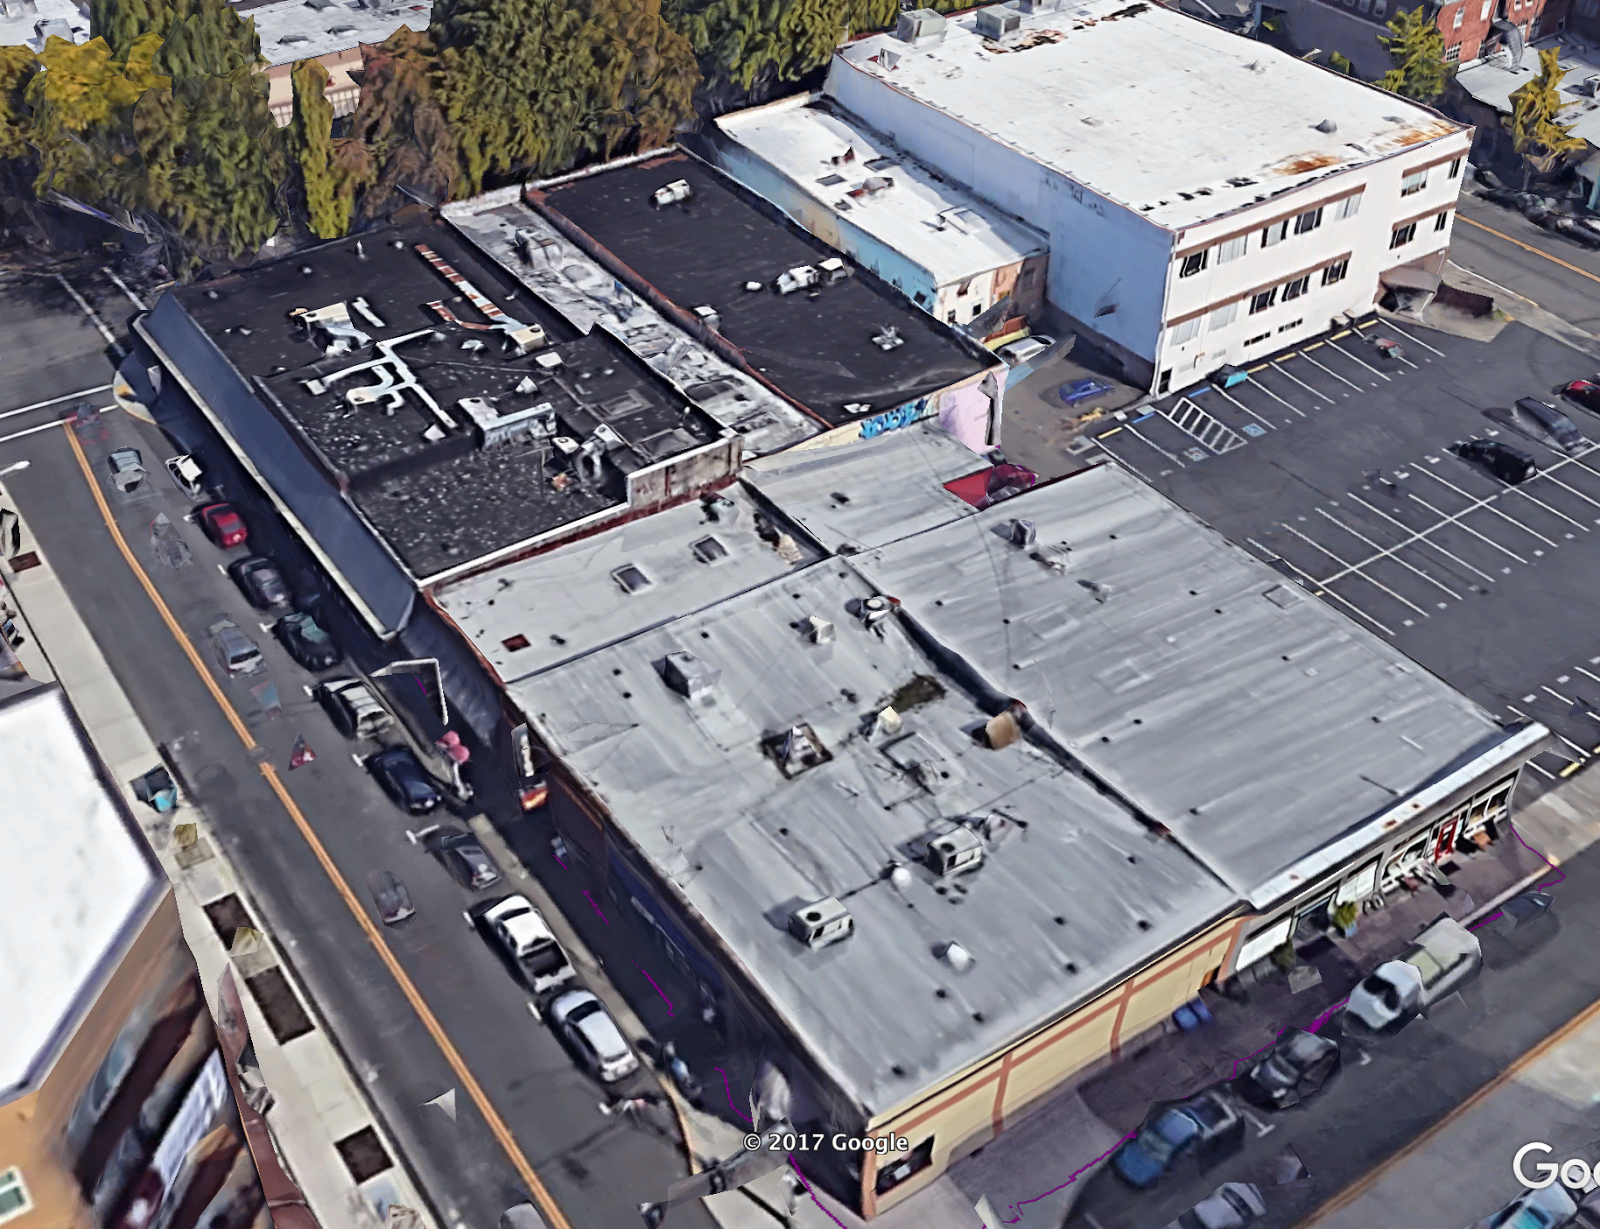
Here’s what you have in downtown Olympia:

These are about as nondescript as you can get in downtown. One story blocks, about six or so businesses. I’m looking only at the north end of this block between Capitol Way and Columbia Street, bounded on the north by 5th Avenue.


Taken together, these businesses cover about 30,000 square feet and pay over $38,000 in property taxes each year.

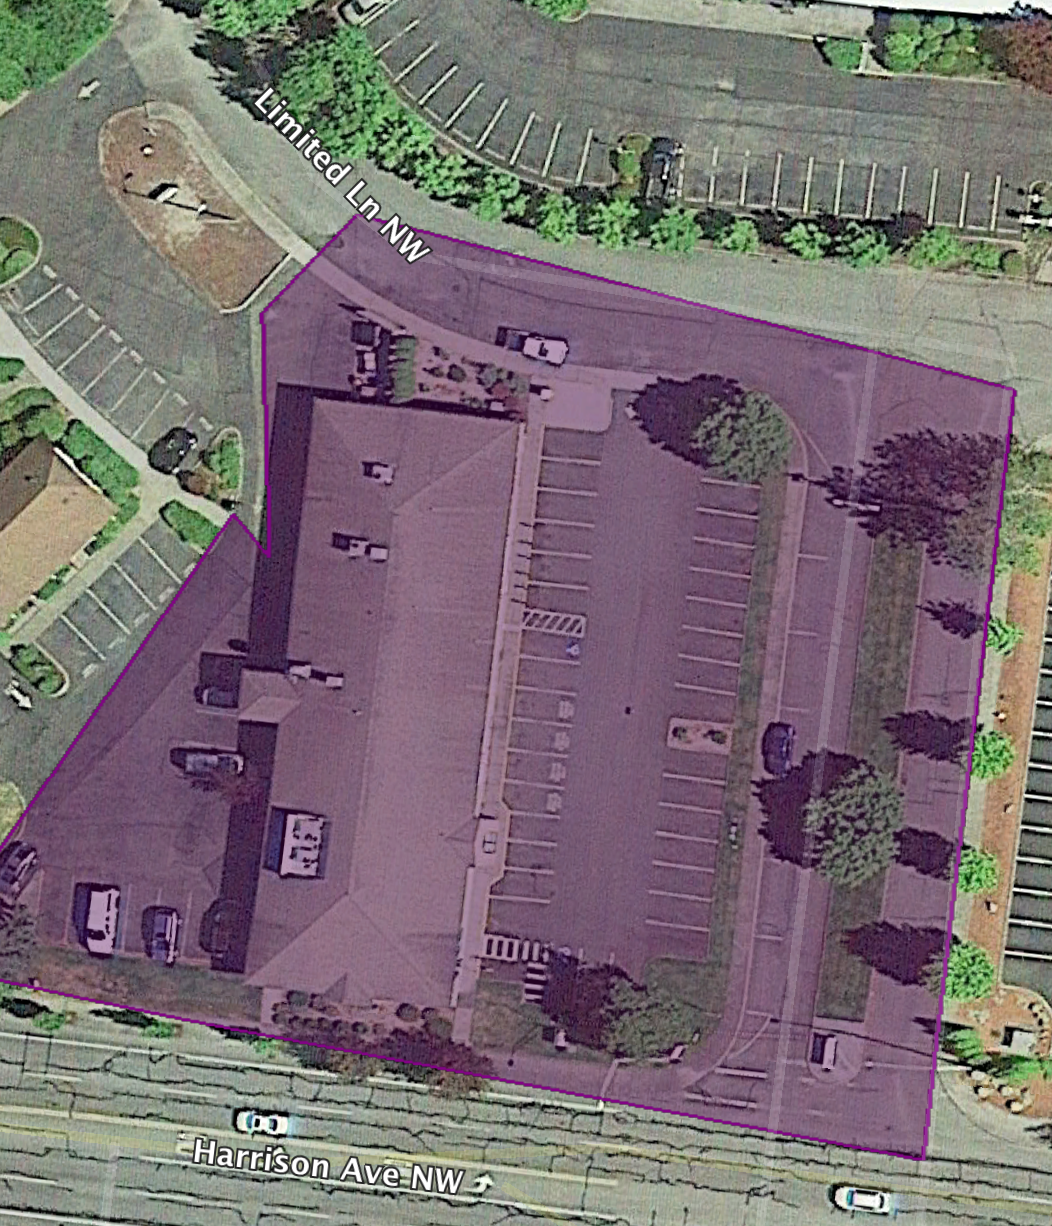
So, now let’s move to the westside. This building is located at near the end of Harrison before it becomes Mud Bay:

In no way is this a new building. It was built in 1981 and the difference between it and the downtown half block is striking. The newest building in the downtown example dates to 1937. This westside building too is one story, but the lot it is one is dominated by road and parking. It was built in an era we’re still living through when how you’d drive somewhere was the most important aspect in development. The need for parking makes this much larger parcel (at almost 45,000 feet), much less profitable with only $17,000 in property taxes.


This is a difference between $1.27 in taxes per square foot and $.37 per square foot. The price of providing space for cars and making neighborhoods unwalkable is real.

Strong Towns writes about this phenomenon, the older “blighted” areas of a community subsidizing the newer, shinier and automobile-centric developments. In the Strong Towns example, a series of closely packed buildings were leveled for a single Taco Johns, which removed much and the economic development from the land and replaced it with parking.

In an area like downtown Olympia, with even more housing coming on top of commercial activity, the need for large empty parking lots becomes less necessary. These aren’t just people orientate places, but they’re more productive by the acre.  

And, because even the dense part of downtown Olympia pays property taxes to both the city and the county, everyone benefits from the high density productivity of these blocks.

Two examples of trying to merge Olympia, Lacey and Tumwater (sort of)

Over direct message on twitter a few days ago, someone asked me if anyone had ever tried to get all three nothern Thurston County cities to join together. Off the top of my head, I could come up with two examples, sort of. As far as I know there’s been no wholesale effort to join the cities together, but I found two partial ones:

1. Fire service in 2009. As far as I know, folks just lost interest and this effort just died off.

2. Merging city and county planning in 1990. This idea went down in flames. It was part of the home rule effort that year, and with the rest of the charter, it was voted down.

This entire idea of why the cities should merge is one that comes up every once in awhile. It isn’t a bad one on its face, just one I know will never happen, mostly because there are bigger evils that three cities bordering each others.

The reasons the cities won’t merge are numerous.

Separate school districts for each city mean people grow up not necessarily crossing city borders socially.

Cities have different histories, interests and trajectories. Tumwater was founded at the base of the Deschutes River before Olympia (on the shores of Budd Inlet), but didn’t become a city until much later. Lacey on the other hand, came along almost 100 years later. And, if you look at how far down Martin Way Olympia stretches, you could almost assume Olympia tried to kill Lace at birth.

In the blocks north of North Street, you can see this kind of municipal racing laid out in the checkerboard border between Olympia and Tumwater.

These histories, interests and trajectories have created three different local cultures (political and otherwise). From Matthew Green in OP&L:

This result is no shock. Olympia voters have supported tax levies for
a new fire station, the library system, and schools by similar or
larger margins. However, it presents a contrast with Tumwater, which
approved a public safety levy by just eight votes (50.11%-49.89%), and
Lacey, which rejected a fire district levy 47%-53%, both in 2011.

This result is yet another reason (approximately reason #12,000,003) why Olympia, Tumwater, and Lacey should not merge.
A few local political leaders pop up once a year or so, like
groundhogs, to suggest that the municipalities merge into one city
government. They imply that city governance is about just managing a few
departments. They pretend that city lines are mere arbitrary
administrative boundaries.

In fact, the three cities contain electorates with distinct and often
irreconcilable political views. They fundamentally disagree about what
is important to their community – in this case, about what public safety
measures are important enough to justify raising taxes. None of them is
right… well, okay, Olympia is right, but the other cities are entitled
to decide for themselves. Rather than stuff three different electorates
into one mass, in the name of false efficiency, let each community make
its own democratic decisions.

 So, for the time being, any merging will happen under the surface. We already have our sewers all merged and transit. Other things like fire might come along, but we’ll likely always have our own cops. And, we’ll always have our borders and separate civic identifies.

Hoquiam and Aberdeen should merge. No reason why not.

This is not a waterfall, but a dam. All about Thurston County Dams

By Waponigirl on Flickr.


Now, I’m sure you see it clearly now. But, what a lot of people call the upper waterfalls on the Deschutes in Tumwater is actually a derelict dam. It is also (according to my list) the oldest dam in Thurston County by nearly 40 years.

There are a surprising number of dams in Thurston County (35 total), now that I think of it. All but one were built in the last 100 years. The busiest decade for dam building was the 1960s (with eight built). I’m also surprised by the number built in the 1980s and 90s (five each).

The stormwater pond dam over at SPSCC has a surprisingly high risk rate, “From 7 to 30 lives at risk.”

Most of the dams — 15 out of 35 — are both earth fill and were built to create recreational reservoirs. Three of these actually have “ski” in their names.

There are also dams in surprising places, Grass Lake for example. This is a small lake surrounded by a City of Olympia park. The dam was built in 1966 for the original purpose (I assume) of irrigation.


View Larger Map

Grass Lake dam illustrates what I take away from the list of Thurston County Dams. Most of us read the word dam and see the Elwha dams, the Grand Coulee or even our own La Grande Dam. Something big, blocking a big river. But, most of these dams are smallish, practically fading into the landscape. You don’t even know a dam is there.

Tumwater Towers, once you know they’re there, you see them everywhere

Where else in Tumwater have copies of this tower spread?

Encouraged (at least in part) by actual City of Tumwater code:

To encourage design elements that convey the historical theme of Tumwater. Pitched or mansard metal roofs, decorative brick facades, and ornamental towers with pitched roofs and decorative cornices are examples of design elements that reflect the history of Tumwater. Several of these elements are incorporated into the designs of civic and commercial buildings along Israel Road, including Tumwater City Hall, Tumwater Headquarters Fire Station and the Tumwater Timberland Library.

Right nearby the actual brewery, for one.


View Larger Map

A sort of not-obvious one, but one that got me thinking:


View Larger Map

Another one, down the street:


View Larger Map

The ordinance above actually lists a few examples of public buildings, so I’m just going to skip those ones and look for some other examples that might not be so obvious.

Do you think this qualifies? I’m almost sure I’ve seen this chain of hotels with a similar design.


View Larger Map

Kind of an easy one, really:


View Larger Map

« Older posts

© 2026 Olympia Time

Theme by Anders NorenUp ↑