History, politics, people of Oly WA

Author: Emmett O'Connell (Page 17 of 177)

Washington had a surge of Independent voters. What does that mean?

Here is the last 10 years of Survey USA statewide poll results charted out (background data), focussing only on how the respondents identified their partisan affiliation.

Basically, following the trendlines, both the Republican and Democratic parties have lost marketshare and three times since 2006 there have been more identified independents than anything else. Also, in the most recent survey from last fall, the independent identification has a big lead.

It is worth noting that independents have always been strong in Cascadia, but I’m convinced we’re seeing something different in this trend here.

What could have caused this?


I have a couple of theories, but I’m far from totally convinced by them.

I think the Top Two primary had something to do with this. Especially, in combination with a redistricting process in 2010 that had a lot to do with protecting incumbency and not with creating competitive districts between the traditional left and right.

So, since the first Top Two primary in 2008 and redistricting races in 2012, we’re seeing more legislative level races that aren’t competitive between the two major parties. So what do member of a minority ideology do when left in the cold without a standard bearer? I think it’s possible they drop the partisan standard all together.

I think there’s also something wrong with how we structure party politics around here that encourages not identifying as a partisan. Basically, political parties, the local county and legislative district ones, aren’t forces in the lives of most voters or even most activists.

Campaigns can be built, volunteers recruited and advertising funded, without a lot of help from local party officials. The web has a lot to do with this, but the fact that the basic party structure is an obscure elected official called a precinct committee officer probably doesn’t help.

What does this mean?


I think we’re already seeing the impacts of what a possible non-partisan identifying stable plurality or even majority could mean in Washington State. With little buy-in with their actual policies, the Thurston County commission is now made up of conservative independents. There is was also an independent election on the Grays Harbor County commission, a more conservative but still usually solidly Democratic county.

Also, in Grays Harbor, you saw them support a Republican for president for the first time since the Democratic party was near its death in the 1920s in Washington State. My guess is that they voted for Trump not because was running as a Republican, but because he was running as a non-partisan under a partisan label.

What could this mean in the future is two things:

One, maybe Bill Bryant could have won if he’d shed the partisan banner. With 41 percent and growing, the independent population in Washington serves as a much handier base than a shrinking third place identification. It also seemed to me that Bryant ended up not running as really a conservative, but as a better version of the centrist pro-government governor we already have.

And two, on the local level, even more independents. I hope.

 It is one thing for three anti-growth regulation independents to be elected in a county that voted overwhelmingly for an urban environmentalist of lands commissioner. That (plus the way we voted for the independents across the county), means that enough voters didn’t know what policies they were actually supporting and just pulled the lever for the non-partisan.

But, what happens when there are two non-labeled candidates in the race? What shortcuts do the voters use to make their decision? Or do low information voters drop out and leave the election to the voters who have their minds made up?

What went on with rural growth in Thurston County?

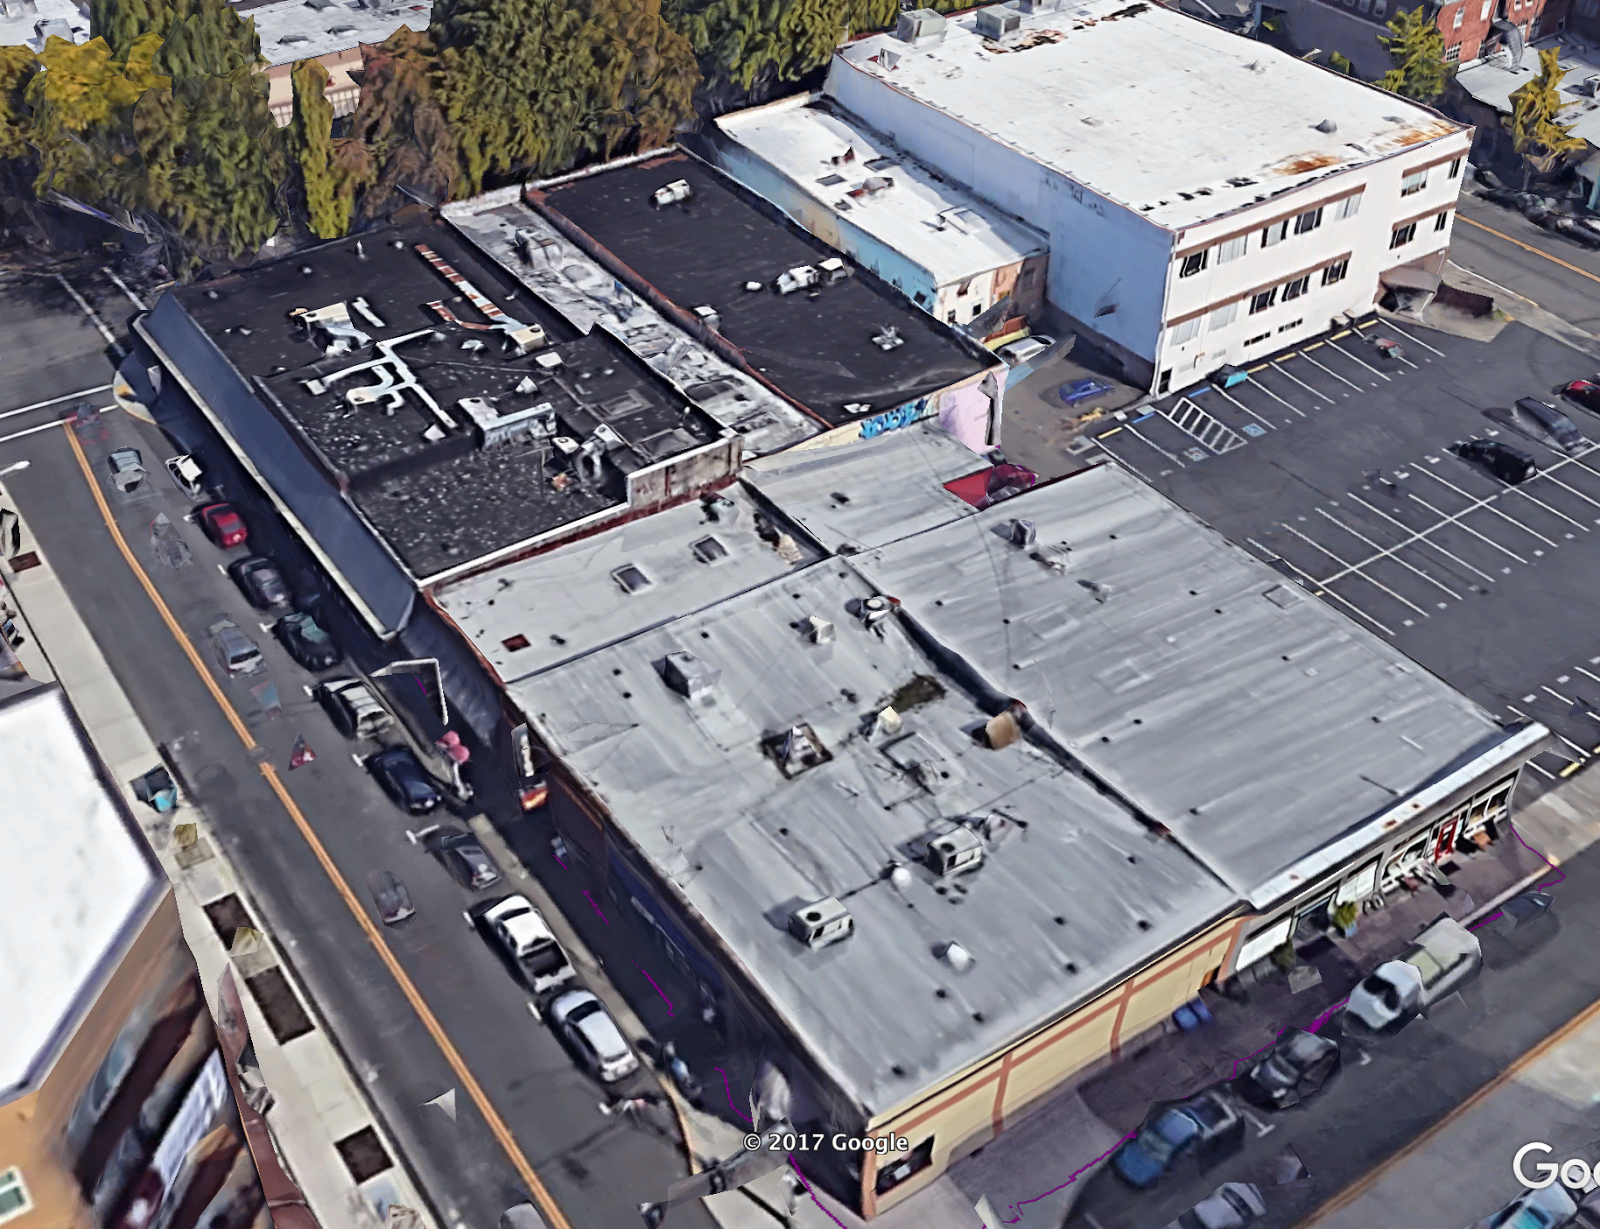
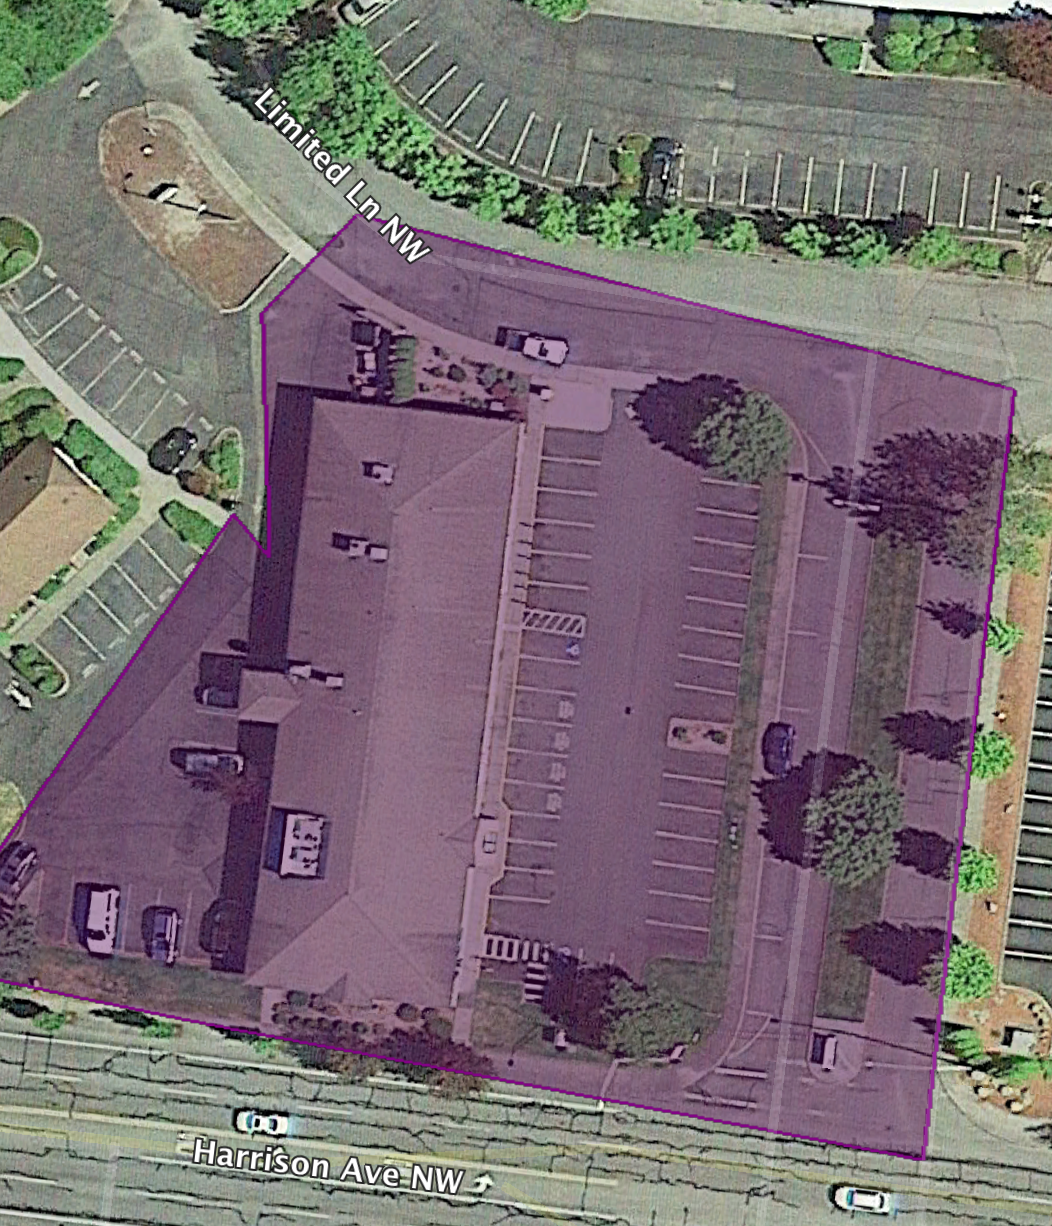
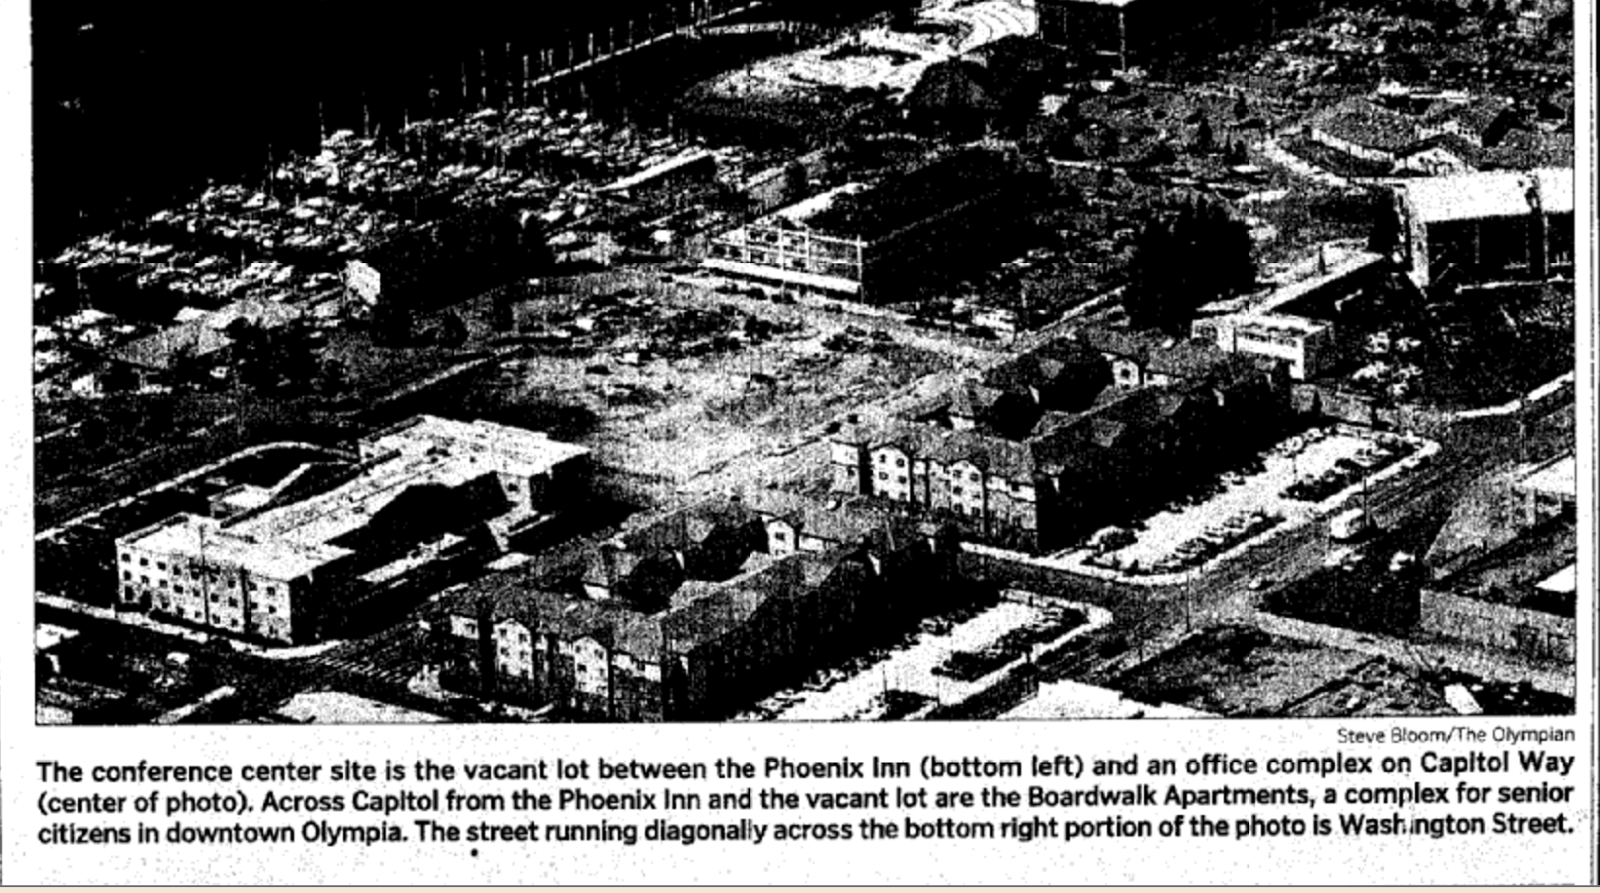
Grand Mound from highway to today:

It wasn’t a member of the Thurston County commission, but there was a county commissioner at a recent hearing on exempt well bills last month. One of our commissioners was there too, but the Mason County commissioner said (and I’m paraphrasing) that the county’s economy needed a boost.

What she was talking about was that building houses, more people living in the rural parts of Mason County would give their county a boost.

Despite evidence to the contrary that rural residential development is good for the government bottom line or anyone’s economic well-being (I mean other than homebuilders and realtors) it did get me thinking about the rural landscape and how it’s either being put to work (with farms or logging) or put to rest (by building houses).

Here’s an interesting chart I’ve been toying with for the last few weeks. It plots the acres of land in Thurston County in farms and logging against the population in the non-city parts of the county:

What I see are a couple interesting things.
One, no one seems to keep track of land in active forestry by county, which is really weird since it is literally taxed differently in Washington and county assessors should really care about that. I was able to find two data points, so it’s just sitting on the chart as something I’d like to add in if I can find it.
Also, I also wasn’t able to find was any sort of description of residential zoning by acreage, so I used general non-incorporated population as a stand-in. This might be slightly unfair since most of this population is concentrated up in Tanglewild. But, as you can see in the gif at the top of this post, even Grand Mound has seen some significant changes since then.
Two, the 1960s seem to be a big turning point in the change of how Thurston County’s rural areas were in terms of a shift from farming to rural growth.
If you zoom in on the 60s, you see the drop off of farm acreage happening just as non-city residential growth picks up.
What is also interesting is that even as no it seems like farm acreage has stabilized, the non-city population continues to increase, which means the rural areas are either getting denser or they’re overtaking acreage that isn’t in active farming.
Lastly, and this is more of a fun fact than anything. I wrote years back about the unincorporated area east of Lacey was Thurston County’s invisible city.
I used to talk about this when I was on the Timberland Library board of trustees about how we should expand library service between Rochester and Grand Mound (which is currently served by a kiosk). But, that if you took the two census tracts that surround Highway 12 between I-5 and the county line, you’d have the fourth largest city in Thurston County at almost 13,000 people.

Read David Scherer Water’s “Olympia”

There are a few books about Olympia that I’d say were necessary to own. To be honest, most of the stuff written about Olympia is pretty bad. Either poorly written, poorly researched or just repetitive, not hoeing new ground. Rogues, Buffoons and Statesmen is on that list, not because it is entirely accurate, but because it is expansive. Confederacy of Ambition is also on that list because it is insanely well researched.

You can buy Olympia at BuyOlympia.com (which is based in Portland).

Olympia by David Scherer Water is also on that list. Not because it is entirely accurate, it really isn’t. It is mostly, strictly speaking, inaccurate. But, in the way that smaller details give way to larger truths, it is the most accurate book about the city we live in today.

Zach Mandeville’s zine series Funwater Awesome was as close a true (but not really true) capturing of what is is like to live here nowadays.

“Olympia” is a thin volume, it won’t take you too long to get through it. But, because the truths are so large and so well presented, I’ve had to backtrack and slowly take the entire book in.

Visitors, especially ones from cities with “bad” crime statistics have noticed Olympia’s “good” crime statistics mask a difficult to gauge social unsafety. “I should feel safe here, but somehow this place feels terrifying. Why is that?”

These are true things about Olympia, but usually they’re put out by five or ten year residents that finally got tired of being polite about one aspect of the way we live here and are just reduced to being whiney. David, an Olympian of 25 years, spells them out with calm and without judgement (seemingly) and at times tries to dig down to or origins.

But then there is the Holy Sh*t Park.

I’m not going to say any more, other than to say that every one of us is blind. David is the only one that can see. I’m too far gone, and most everyone I know is as well. David sees reality in the case of this park. Just read the book, you’ll see what I mean. I don’t want to go over it too much, David will lose his patience.

14 percent of septics are failing because we saw the dye

I wasn’t going to write about this 14 percent thing because I didn’t really think it needed explanation to begin with. But, there it is, still out there. Like a thing that exists, because it came out of the mouth of County Commissioner Gary Edwards:

The main thing we need to get to the bottom of is what science brought this about because it has been alleged that 14 percent of septic systems failing each year — that is pure malarkey. That means at the end of a seven-year period we would have had 98 percent of septic system fail, that is pure ludicrous.

Basically, there’s a fairly good estimate out there that somewhere around 14 percent of septics system are polluting into streams and bays each year. This data, in the case of Thurston County came from an on-site study of septic systems around Henderson Inlet in the late 90s.

What county staff did was put a dye into the septic systems around Henderson Inlet and 14 percent of the tested systems leaked that dye into places where they shouldn’t be leaking anything because septic systems shouldn’t be polluting. But they did.

What that particular study didn’t say is that 14 percent fail each year. Obviously, if you go around and test septic systems at one point in time and finding a failure rate, what you’re doing is finding how many septics would be failing at any given point. 

Commission Edwards apparently picked up his bad math from Glen Morgan’s blog.

What is a little more interesting is that the 1999 study took a look at two places, Henderson Inlet and the Thurston County stretch of the Nisqually reach. The Nisqually reach septics had an even worse failure rate, in the neighborhood of 20 percent.

Morgan took a shot at the 14 percent number by pointing out that repair permits issued by the county indicate that less that one percent of the septics in the Deschutes watershed had failed. That assumes a one to one ratio of permits for repair and actually polluting septics.

But, it would seem that a failing to the point of needing obvious repair and a polluting septic are not the same thing:

Sometimes a (septic) failure is obvious, other times it’s not so obvious and not
an easy thing to confirm. When a failure is not obvious but water
quality data or other information seems to implicate a system as a
problem system, additional measures must be taken.  

Dye testing is an effective way to verify a failure, but
must be done correctly based on established
procedures. Little is more definitive than seeing
bright green dye flowing in a backyard or in surface
water after passing through a property’s plumbing. 

Waiting for a homeowner to ask for a permit to repair their septic system is a very low bar to estimate failing septic systems. And, not all backed up or broken septics are polluting. And, certainly, there are septic systems that would work from the point of view of the homeowner but would leach pollutants.

Dye testing, the type of study that the 14 percent number came from, is much more accurate to asses the one thing that we’re talking about here, whether a septic system is polluting.

How Olympia city council district could look like

Rob Richards has a lot of reforms he’d like to see in Olympia, city government structure wise.

Some of his ideas are pretty interesting (like hard wiring advisory boards into city decision making), but one of them seriously caught my interest. Rob said that we should elect city council-members by district, rather than at-large.

He doesn’t really get into saying exactly why, but I’m reading into it that its likely because city councilmembers now are concentrated in one or two parts of town. I’m not sure this is true. Last year I tried to go back as far as I could to see what neighborhoods city councilmembers came from, but I got bored looking through the city guidebooks at the library after a few elections.

Either way, council districts Rob laid out are pretty simplistic. Basically, he draws one down the middle (downtown and South Capital) and then Northeast and Southeast and Northwest and Southwest on each side.

At first glance I thought Rob’s districts would be way out of balance, especially the middle one. Hardly anyone actually lives downtown right now and South Capital wouldn’t be big enough to bring that district into balance.

Here’s the map I came up with as an alternative:

I used Dave’s Redistricting Tool (which is pretty cool) to draw five districts around 9,300 voters each. I didn’t land any of the districts on the nose, but I got as close as I could. To really get close, we’d need much smaller voting precincts. Districts this small can’t be very precise.
Generally speaking, this is the same map as Rob’s, one district downtown and then two on each “side” of downtown. The difference here is that the downtown district also includes much of the older Eastside. 
Also, I split the westside to inner and outer districts. It worked balance wise, but I also think it worked culturally. If the point of districts is to give each different part of town a voice, the real split on the west side is the older neighborhoods and the new ones west of Division.

How Democrats could have won the Thurston County Commission

[EDIT 12/26/16 at 3:50 p.m.] I added an explanation of the chart and added a link to Steve Salmi’s post at Green Pages that I meant to include.

Okay, so it’s true that there was more voter participation by south county voters in the last county commission election.

But, I’ve have had a hard time reconciling the data I see in this chart below with the map I put together in that linked post above.

This chart ranks independent and Republican returns across a partisan spectrum in Thurston County. The most conservative precincts towards the left, the more liberal on the right. What is shows is that independent returns tracked well with Republicans and a consistent number of otherwise Democratic voters across nearly every precinct switch independent. They had the same slope, just one was a bit higher.
The map included in the post I linked to shows greater participation by south county voters than in recent elections. The story is that that there was increased participation driven by the rural policies of the current commission. The chart above shows voter confusion across the board. That no matter where you landed on the partisan scale of Thurston County, more people voted for conservative independents than for down-ballot Republicans.
The pro south county argument would be that a Democratic voter in rural Thurston County would vote independent because they were tired of how the county was treating rural residents. Well, sure, okay. But, that doesn’t explain the behavior of typically Democratic voters in the cities, were the plight of the rural landowner is less well expressed.
So, if you erase what I call voter confusion from the north county cities (Lacey, Olympia, Tumwater) by pasting the partisan down ballot results over the county commission results, you get a 1,600 vote margin for Democratic county commission candidates. Here’s my spreadsheet (column O in “if cities stayed pat”).
This sort of contradicts what Steve Salmi is talking about at Green Pages:

What the data suggests is that urban Democrats will not win a county commission seat unless they are competitive in unincorporated parts of the county — which even in a high-turnout, Democratic wave election like 2008 represent the majority of votes. In 2016 both of the Democratic candidates got clobbered in that realm. To make matters worse, as I discuss here, neither Hulse nor kindred spirit Jim Cooper did very well in Lacey or Tumwater. Interestingly, these two cities saw their proportion of total votes jump 2.5 percent over 2008 while Olympia went down by .1 percent. 

This is why I suspect that in 2016 something more was going on than high turnout in the south county. Steve Klein may be at least partially right — Donald Trump had coattails. However, the most important single factor may have been that Gary Edwards and John Hutchings ran as independents, which appealed to swing voters throughout the county.

What I’m saying is that if Democrats maintain a more typical partisan lead in the three northern cities, then they’d be able to overcome even a very energized rural vote.
So, if the Democratic candidates had been able to sew the story that independents really were Republicans in sheeps’ clothing, then they would have been able to tighten the results. That said, I know they did try to do that. In low information races, it’s hard to create an effective narrative sometimes. But, maybe in two years, with a strong majority, the conservatives will shed their sheep clothing and progressives will be able to make a better case.

Well look at that, it really was a south county revolution

Back a few days after the election, Ken Balsley had this to say:

I’ll be honest, I really doubted Ken’s assessment of the election of two party-independent conservative candidates over two Democratic ones. I was looking at the graph below, and I saw something totally different in the election returns:

What I saw was voter confusion, a thick-enough layer of voters that wouldn’t vote for a Republican but would vote for a party-independent conservative across every precinct, from the most conservative ones to the most liberal.

But, that chart doesn’t deal with voter turnout, only percentage of vote across a precinct.

I had to wait until the precinct level turnout data was available earlier today, but I was able to put together this map (based on this spreadsheet) that compares ballots issued against votes returned for conservative candidates.

And, if you do that, this is the map you get:

Just a quick word of warning: this is the back-of-the-napkinest of back-of-the-napkin maps. Because precincts have changed a lot since 2008, I did a lot of deleting of precincts because they didn’t match up anymore. That said, think the analysis stands.

This isn’t a map about winning percentage, but rather conservative turnout compared to possible turnout. And, it really shocked me. It really does show that conservative turnout really did increase this year when there were two independents on the ballot and that turnout was centered mostly in south county.

If I had been right, the colors would have been much less stratified across the map, much more dark in the north county and much more bright in the south county. But, the pattern here is clear. Conservative voters were much more active this year in the south compared to the last four commission cycles.

Opportunity for Olympia for All

A week or so ago I took a look at the geography of the failed income tax in Olympia.

And a while back I looked at the geography of voter drop-off in citywide elections.

Now this week, I put them together!

The exercise I did on drop off was to figure out if there were neighborhoods that were more robust in their support of the original statewide income tax and the local version. Where did the vote for the first tax (which passed in Olympia) drop the least when it came to the second vote (which failed in Olympia)?

The purpose is to find out if there is a correlation between a neighborhood a robust supporter of an income tax and a neighborhood where fewer people would vote in a city council election.

It looks like there is a “slight” correlation (in the words of a smarter person that I asked to take a look at the numbers for me):

This chart is not mine (that smarter person did it), but I did collect the data:

So, if you’re a local political group that is interested in progressive politics, changing city hall and increasing participation in local elections (like Olympia for All, amiright?) these precincts that ranked both high in tax support and low in local voter turnout would be your main targets, right?

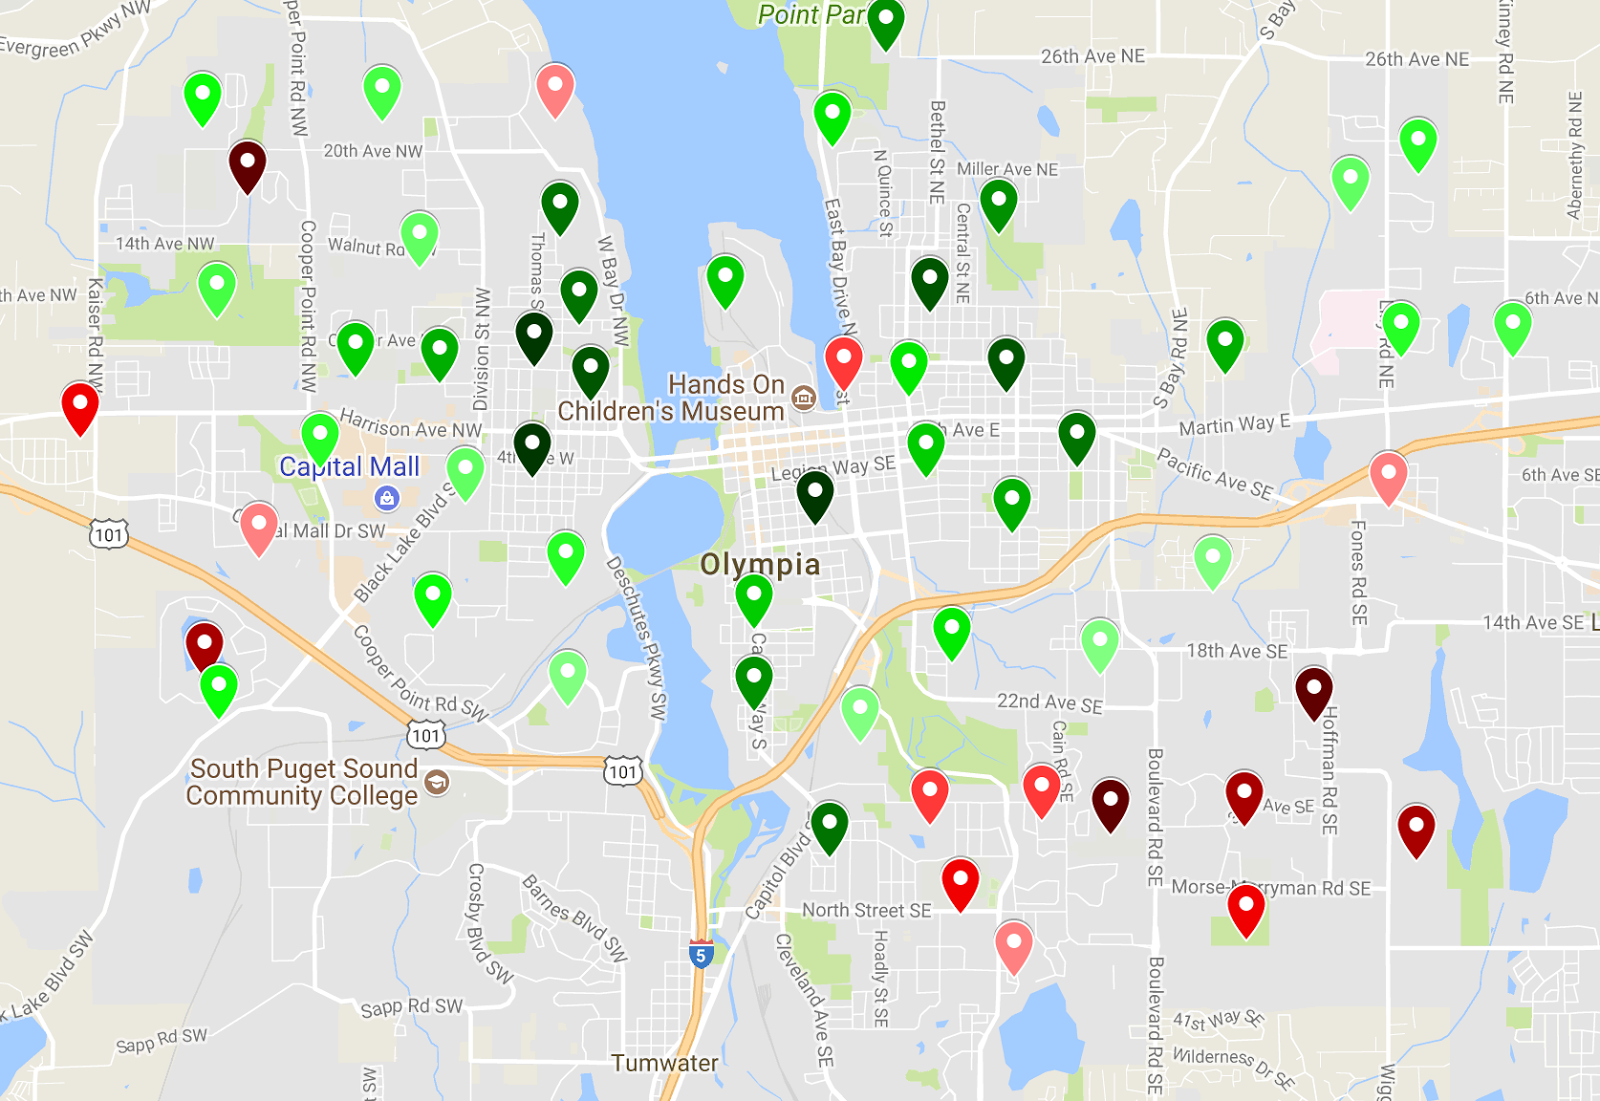
In the map below, I categorized the neighborhoods, combining their rank in voter turnout with tax support, and came up with four categories. Green is the best, then yellow, orange and red.

Except for downtown, this is a very interesting map to me. Southeast Olympia as a broad swath of orange, that’s not surprising at all. That’s where you’d expect higher turnout and a lot of side-eying of progressive ideas.

But, the green neighborhoods are fascinating. They’re mostly newer, non-walkable and high density neighborhoods on the edge of Olympia.  There is a large collection of them along Harrison Avenue west of division and the most of the ones on the east side are east of South Bay Road.

And, a lot of the typical close-in, very walkable neighborhoods rank very poorly. And, this isn’t just because they retain participation in local elections. If you go back to the Opportunity for Olympia map, you see less support for the local property tax.

There is opportunity out there, but it’s among the newer apartment buildings and neighborhoods on the edges of town.

Drive-throughs are worth it if it means doing something in Briggs Village

Something is better than nothing at all and we’ve been waiting a really long time.

Update (11/22/16 (9:22 a.m.): the planning commission voted in favor of the amendment to allow drive-throughs last night.

Last night the Olympia planning commission held a public hearing on allowing drive throughs inside the commercial portion of the Briggs Urban Village. Long the dream of walkability and livability in the SE Olympia sprawl, Briggs has been an urban village in name only. It has been a moderate mix of mixed density housing. But even there, the real diversity of single family homes and high density apartments are kept well separated. Lots of great townhouses though. That’s a plus.

Anyway, lacking a core tenant like a grocery store in the commercial core of the neighborhood/development, the idea to encourage smaller junior anchor tenants was put forward. Ralph’s Thriftway was supposed to move in at some point, but apparently that plan has fallen off the table. So, these kind of tenants would be drugs stores or coffee shops. In our case, Bartels or Starbucks.

But these folks need drive throughs. From a letter written (pdf) by the commercial broker currently selling Briggs Village locations:

As part of our efforts to attract junior anchor retail tenants, we have had several conversations
with representatives of Starbucks and Bartell Drugs. Starbucks has had an interest in the site for
quite some time, but the company will not consider new locations without a drive-through, especially in suburban areas.

While Briggs is an “Urban Village” under City of Olympia
regulations, as a practical matter it remains a suburban site
for purposes of retail site selection
criteria.
An anchor tenant with wide brand recognition like Starbucks or Bartell Drugs would draw other
brands and businesses such as restaurants and service oriented businesses, as well as
professional office tenants. The variety of such a tenant mix will create synergy thus attracting
customers. 

Essentially, you can put an urban village inside a suburban sprawl, but that doesn’t mean the suburban sprawl will suddenly be urban. Southeast Olympia is the least walkable part of town. To get anything done, short of going to school or maybe a park, you need to drive. There is a YMCA down here, but unless you’re literally me or my immediate neighbors, you’re probably going to drive there too. Also, you’re likely to use a vehicle to get to school or the park. Just saying.

Also, this is not a lecture on the value of walkability. You can find that elsewhere.

So, while Briggs without coffee shop or drugstore drive throughs would be nice, in the current reality, we’re never going to get a real urban village with houses, townhomes, apartments and commercial development without them.

But, we should still work to infill and rethink the entire landscape of SE Olympia to make it more walkable and more diverse, we should do that too. But, that is a much bigger piece of work. Maybe some day, we’ll abandon the drive throughs.

Four things to think about the 2016 Thurston County commission races (2014 all over again, sort of)

Over the past couple of years, I’ve been rolling over how an independent candidate with conservative values was elected in a usually safe Democratic county. Bud Blake’s win in 2014 over Karen Valenzuela took a lot of folks by surprise, so a double repeat of that victory for the other two commission seats by Gary Edwards and John Hutchings was supposed to be preventable.

I was thinking that a larger electorate in a presidential year and more awareness of the nuances of an independent campaign would help seal a Democratic win. Anyway, that didn’t happen. Let’s look at how.

1. Just like 2014, it was a matter of beating the typical Republican

In 2014, Blake was able to beat a typical Republican in every precinct, from the most conservative to the most liberal. In most of these districts, even the very most liberal, there was a layer of voters that would not for a Republican in a down ballot race (attorney general, lieutenant governor) but would vote for an independent against a  Democrat in the county commission race.


2. Unlike 2014, core Olympia liberals did not abandon the ballot 


Something I noticed later was that if you looked at 2014 results in terms of turnout, the closer you got to Budd Inlet, the more likely you were to not fill out your ballot when it came to the county commission race. While these lost voters would not turned the campaign to Valenzuela then, it made it practically certain she would lose. Countywide, dependable liberal neighborhoods in Olympia need to turn out for Democrats to win.

While there was a geographically based drop off in voting, it seemed to have happened not in the home base of the more liberal candidates, but in the in-between area of the two camps. In the map of above, higher turnout for the county commission races are darker. So, in my reading, the lighter placemarks are mostly in either politically stratified neighborhoods around south county (Republicans and conservatives) and Budd Inlet (liberals and Democrats). Both camps did a good job getting their base to vote. And, the suburban tweeners stayed home. Well, we all stayed home. It’s vote by mail.

3. BONUS: Kelsey Hulse did not improve her mark from the primary

If you take just the precincts that were involved in the Hulse Edwards primary back in August (commissioner primaries are just in the district they represent), she did just a percentage worse. Which isn’t bad. Standing pat in the more conservative east district (Yelm to the eastern portions of Lacey) isn’t a bad strategy for a liberal candidate.

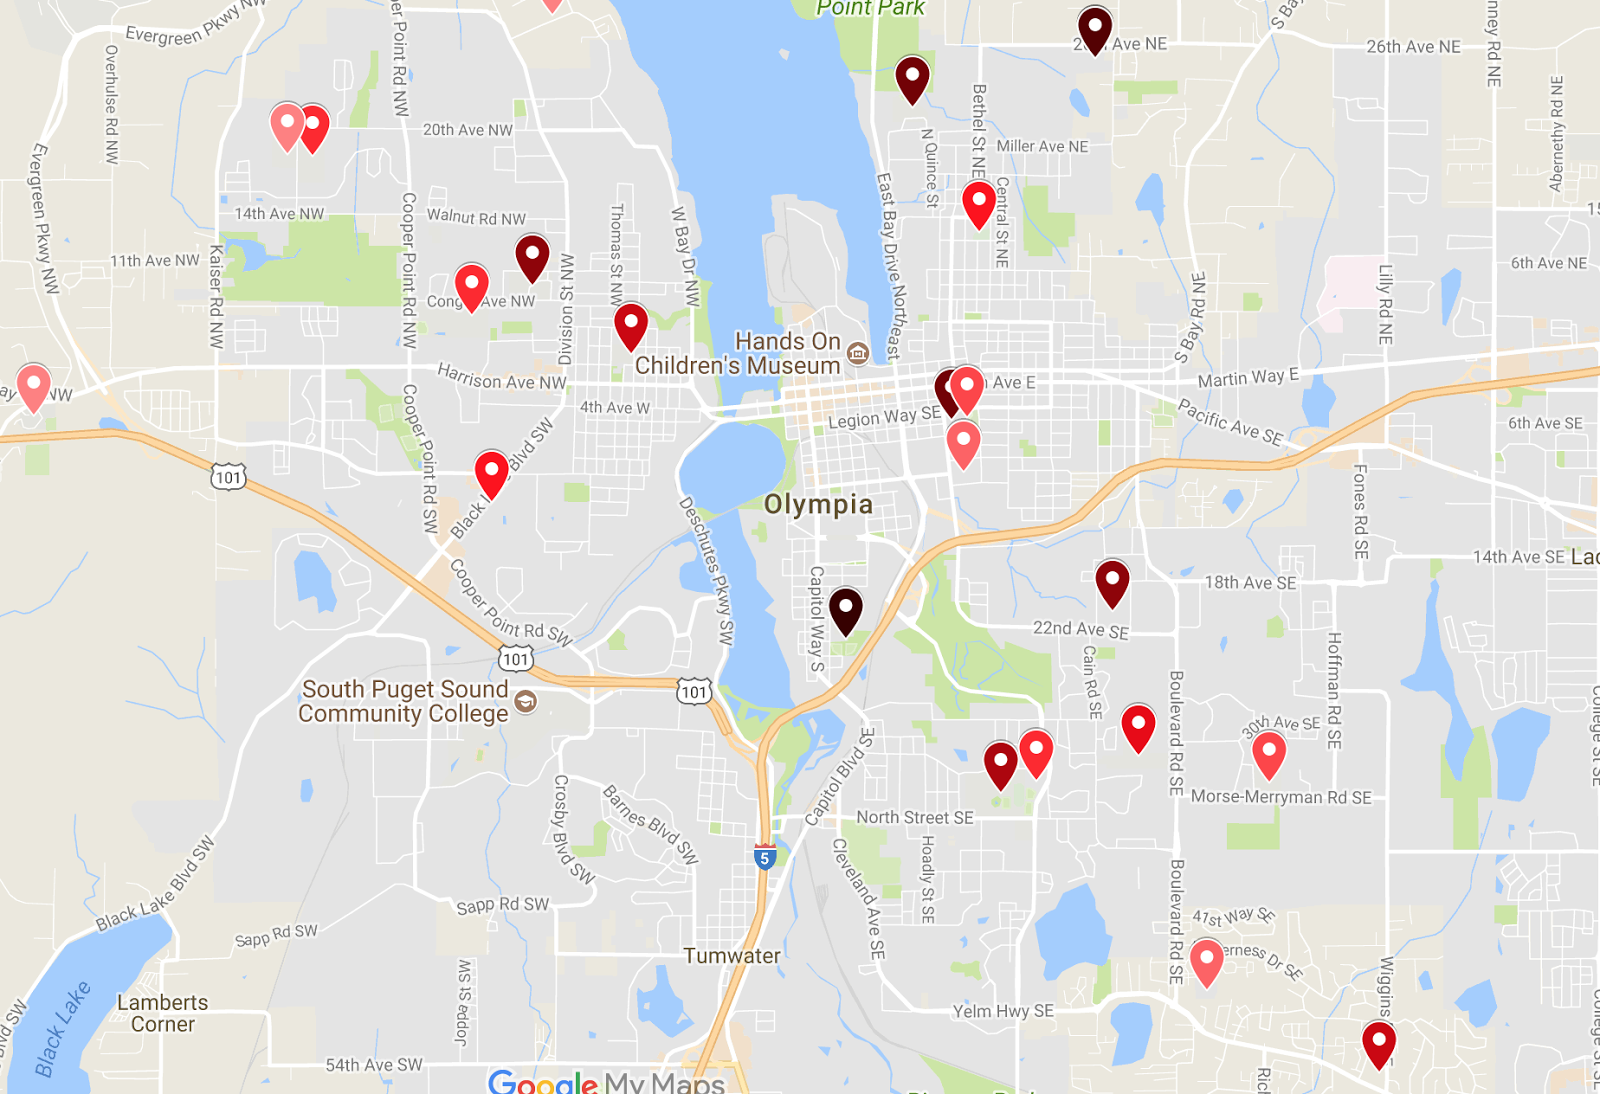
And, of course, since I have place information for these precincts, here’s a map of where she did better.

The darker the pins, the better Hulse did compared to her primary finish.

Looks like a lot of nothing to me. Not that there wasn’t some moving around, there certainly were some places that she did better in (and worse in) November to August. But, I don’t think it makes geographic sense to me. I’m mostly sharing it because I want to see if anyone else sees a pattern I don’t.

4. SUPER BONUS: Hulse did better than Cooper in Olympia


From the brand spanking new Green Pages (which makes it a super special bonus), Steve Salmi writes:

One could argue that this occurred because Edwards was the tougher opponent — but only outside the liberal Democratic stronghold of Olympia. 

By the same token, one might suggest that Hulse’s campaign materials did a better job than Cooper’s of energizing liberals. This, in turn, may have partially been because Hulse raised roughly $74,000, a good $12,000 more than Cooper, according to the Public Disclosure Commission

One might also wonder whether a robocall that attacked Cooper had an impact. But again the question arises: Why did he outpoll Hulse everywhere else except for Olympia — particularly if the robocalls targeted south county residents? 

Perhaps other factors may be at play. For example, did Hulse more aggressively doorbell in Olympia because, unlike Cooper, she needed to introduce herself to a core voter base?

« Older posts Newer posts »

© 2026 Olympia Time

Theme by Anders NorenUp ↑