Olympia Time

History, politics, people of Oly WA

Page 11 of 174

5 things to take from this year’s Thurston County primary election, mostly in map form


1. Holmes got smoked.

This doesn’t take much explaining, his overall percentage (32 percent) of the vote being what it is, seeing Stuart Holmes mapped out doesn’t give you much more insight.

At the very least, he follows the same north to south, liberal to conservative pattern that we usually see in Thurston County. Conservatives work from south to north, liberals the other way around. But is the independent label magic gone? I mean, I can’t expect he did much better as an Independent than he would have done as a Republican.

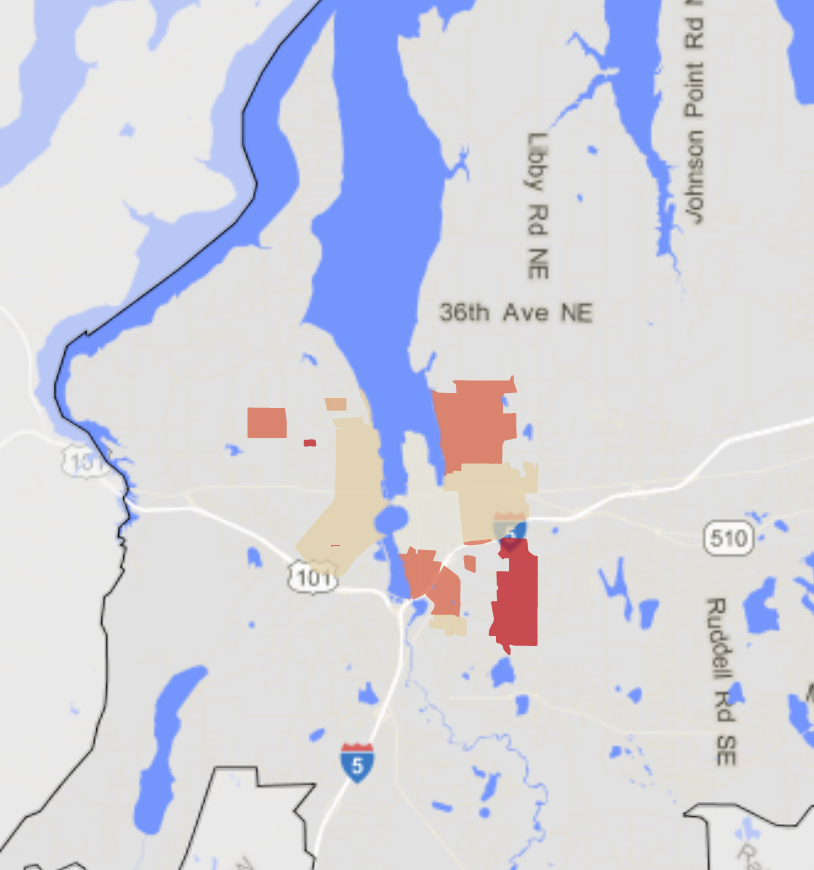
2. Where did these Minjares precincts come from?

One thing you can say about the Hall/Holmes race for auditor, is that it followed the typical south to north, conservative to liberal track of Thurston County. The Tunheim (as the conservative) and Minjares (as the liberal) results follow the same track.

But, Minjares won a handful of precincts both in the far southeast part of the county and out in Lacey. Alternatively, Tunheim won a lot of precincts inside Olympia that I would have assumed stayed on the liberal side of things.

There are different dynamics in play in this election than we’ve seen in local elections recently. Things like diversion programs and how prosecutors choose to advance cases aren’t your typical county-level land use questions we deal with. So, I’m wondering if we’re going to see a new map emerge.

3. Bud Blake lost in no small part because he lost ground in rural precincts

Bud Blake lost this primary even though he got the most number of votes. He finished with less than 40 percent of the vote, while the rest was largely split between two Democrats. You can say he lost because he wasn’t able to get distance from two Democratic challengers and as an incumbent, he trailed the 50 percent mark by a large margin.

But, I say the biggest reason he lost is that he lost to himself four years ago.

Most surprising in this map was how poorly Blake did against his own results in the primary four years ago. Sure, he lost votes in Olympia (not so many in the water facing districts, more in the newer neighborhoods). But he lost a lot of votes in the rural precincts, especially in a handful around Rochester. In some of these precincts, he ran twenty percent better four years ago.

4. What kind of voters are Denton voters?

Being able to predict what will happen in a few months in the general election depends on how the voters for a failed primary candidate decide to act. In this case, the voters who chose Melissa Denton will decide whether to support Blake or Menser. And where they decide to go depends on how they saw Denton. If they made the choice for her because they saw her as more moderate than Mesner, then Blake might actually pick up some of those votes. Even though I’ve heard people say she’s the more moderate choice, I’m not sure.

The most Denton precincts in this map seem to be a straight line from the outside of the Olympia westside into Tumwater, which gives some credibility to her being a moderate candidate or at least a moderate candidate from the voters’ point of view. But, she also won College, which is the most liberal precinct in the county. So, who knows?

5. Can Blake make it back?

This is a non-map segment, mostly just an explanation of how difficult I think it will be for Bud Blake to win in November.

So, we start with three things we know: Bud Blake got 35 percent in this primary, 48 percent in the 2014 primary and won the general in 2014 with about 55 percent of the vote. Because primaries for county commission are run in one of three districts and general elections are county-wide, you can assume that Blake found an increase of support in the other two districts in 2014. But that is not what happened.

If you pull apart the 2014 general results, he did slightly better in the third district (his home district) in the general with 55 percent than he did in the other two (54 percent). So, it isn’t like there is a new, untapped well of support out in those areas that haven’t weighed in yet. As it stands, he’ll have a harder time of it when the geography expands, if only slightly.

And, this year, he’s starting well further behind than he did in 2014. If you take the returns from the 2014 primary and general and extrapolate primary returns for the other two districts (like on the back of a napkin for example), Blake only finishes at around 45 percent in a 2018 general. But, that is only we consider his comeback in 2014 as the limit of his ability to climb.

Which, since we’re likely looking at a “blue wave” election this time around as opposed certainly not a blue wave in 2014, that ceiling for Blake might well be a hard one.

State conservation commission: Johnson and Mankmeyer should be removed from Thurston Conservation District board

Eric Johnson and Richard Mankmeyer should be removed from the Thurston Conservation District Board, according to a recommendation by the state conservation commission staff.

Their recommendation is outlined in the final report of a months-long investigation by the conservation commission into the last few years at the Thurston Conservation District. The report to state commission executive director Mark Clark and the commission members recommends Johnson’s and Mankmeyer’s removal based on multiple counts of neglect of duty and malfeasance.

For now, I’m simply reading the report itself and adding in details I find important. Basically, anything above the background links won’t change (unless I note it) but any additional information below that may likely grow. I’m setting this to post automatically publish just after 10:30 p.m. on Wednesday, July 18. But I’ll be adding more information to this and posting additional separate posts later on.

Also as usual with how I’m writing this, I’m trying to take care and clean up typos as I go along. But if you find some, just let me know on the sly and I’ll fix them. Thanks!

You can read the entire report here.

According to the report, the specific counts against Johnson are:

Exhibited Neglect in Duty by: 

1. Utilizing his position as District Supervisor to obtain special privileges or
exemptions for himself;
2. Not maintaining timely and accurate records of District business;
3. Not responding to public disclosure requests promptly,
4. Delaying the signing of District checks, and
5. Inappropriate conduct toward staff. 

Exhibited Malfeasance: 

1. By wrongful conduct in failing to participate in a scheduled hearing;
2. Inappropriate conduct toward staff creating potential liabilities for the district;
3. Failure to comply laws and rules of the state; and
4. Not allowing a supervisor to perform their duties.

And against Mankmeyer:

Exhibited Neglect in Duty by: 

1. Not maintaining timely and accurate records of District business,
2. Not responding to public disclosure requests promptly,
3. Delaying the signing of District checks and timesheets, and
4. Inappropriate conduct toward staff. 

Exhibited Malfeasance: 

1. By wrongful conduct in exhibiting inappropriate conduct toward staff creating potential liabilities for the district; and
2. Inappropriate conduct toward staff.

So, that’s is the basics of it but there is a ton to unpack here. For now, I’m going to let the above stand as a summary of what has been concluded by the staff. But I’m going to keep on writing below, adding stuff as I go along and see how far I can get.

First off, here’s a few links for background reading and listening.

Where it all started for me with this post: It’s time to acknowledge how messed up the Thurston Conservation District is and you should vote to change that.

My podcast partner and I did a great episode of The Olympia Standard that summarized what was going on out at the conservation district as of mid-February. You can listen to that here.
The Olympian joined in on the fun (here, here, here and later here). Hand to God, someone owes Abby Spegman a beer or something for getting this quote: “Joel and the bureaucratic bootlickers may not appreciate that, but that is my commitment to taxpayers. As a farmer, I’m used to dealing with manure and manure spreaders.”
As you might have surmised through clicking on some links and reading further, there was eventually an election that crystallized how people felt about the current leadership of the conservation district.

It turned out like this: Folks, how do you feel? Oh, you elected the candidate most opposed to Johnson and Mankmeyer? Like with record turnout? Despite a super messed up election system? (Another blog post I have about that) Wow, that’s great!

So, let’s keep going and circle back to the report itself. So, how bad are things out at the conservation district, really? Oh my god, so super bad. There are a lot of things that have gone bad at the district lately, but here are a few the pop out to me.

1. Johnson knows all about the manure spreaders. For this we know is true.

Remember back a few paragraphs when I said that I really loved the quote “As a farmer, I’m used to dealing with manure and manure spreaders.” I mean, Johnson was implying a whistleblower (Joel Hansen) was full of bullshit.

So, that makes this part of the report really super interesting to read:

The cost-share agreement requires implementation certification by District staff prior to a landowner receiving cost-share funds. Implementation certification requirement include a site inspection by District staff to verify completion and the project meeting required standards.  

When arriving at Johnson’s dairy farm he was unable to verify if the piping installed met the required standards as the pipe had already been covered. Johnson stated to Nygard the piping did meet the required standards and requested he approve the project so he could receive the funding. Nygard was hesitant to approve the project without being able to see how and what type of piping was installed. Nygard stated he felt pressured by Johnson to go ahead and approve the project. Nygard stated previously that Johnson had spoken negatively of other District staff to him. Since Nygard was close to retirement, he did not want to cause trouble with Johnson. Out of concern for possible retaliation from Johnson, Nygard went ahead and approved the project so Johnson could receive the funding. 

District Executive Director Kathleen Whalen stated in her interview Johnson approached her during the time he was installing the manure transfer system and requested of her to petition the Commission for additional funds to cover the costs of his project. Mr. Johnson had been approved to receive $38,000 in cost-share funds. She stated he continued to request of her to seek additional funds for his project. Eventually, she did approach the Commission and was able to receive an additional $4,296 for Johnson’s project. In the end, Johnson received $42,296 in cost-share funds for his project on his personal dairy farm.

2. Yeah, geez the timesheets and checks. Or, the gang who couldn’t approve minutes decided they wanted to start signing checks.

One of the most interesting wrinkles for me about this entire drama has been the story about how one of the board members wouldn’t sign checks. It has always been a fascinating part of government board membership to me that governing boards (city councils, trustees) actually approve all spending above a certain level on a check-by-check level by a government agency. In most cases this is done so quickly it is on a section of the meeting agenda called the consent calendar. Basically, it acts as a clearinghouse on the agenda to take care of regular boring business like what checks the agency needs to pay its day-to-day bills.

Real financial discussion happens when you put together an agency budget. Lots of discussion on the consent agenda means either a board member doesn’t understand the agency they’re leading or there is a lack of trust.

But for the Thurston Conservation District, it went somewhere deeper. I mean, obviously.

From the report:

Supervisor Mankamyer has refused for up to two months to sign District checks since his appointment as District Board Auditor during the November 1, 2017 District Supervisor meeting. Many of these checks were for reoccurring payments (rent, leased vehicles, utilities, etc.) already approved in the District’s annual budget. This has resulted in late fees assessed to the District and the District not following established fiscal procedures previously approved by the Board. 

Additionally, since Mankamyer has been appointed to sign Acting Executive Director Moorehead’s timesheets, timesheets have gone unsigned for over two months. Because timesheets must be submitted to various funders, the failure to sign the timesheets has created delays in billings to grants and payments back to the District.

Up until very recently, an accountant would actually sign checks approved by the conservation district board. But that changed: “On November 1, 2017, the board voted 3 to 1 (Johnson, Mankamyer, and Powell for and Fleischner against) to appoint Mankamyer as board auditor. Rushton was not in attendance and Fleischner expressed concerns to the chair on making appointments without the full board (Rushton) not being present.”

So, how did that turn out? Well, despite an insistence that the board needed to take direct control of the district’s finances and that he would train up, apparently Mankmeyer didn’t do so well.

From the report again:

Emails and statements from District staff established Mankamyer has been given ample opportunity to receive training, ask questions and be provided resources needed to fulfill his duties as appointed District Board Auditor. His actions resulted in the delay in payment of on-going expenses in violations of District policy.

Housing affordability for first time home buyers is getting close to a record low in Thurston County

Thurston County is growing, but we aren’t building enough housing to keep up with the increase in population. So, housing affordability continues to fall and housing affordability for first time home buyers is approaching an all-time low.

The Rustad Center at the UW recently posted up to date housing market data for the first quarter of 2018 showing how a constricted housing market is driving up costs in Thurston County.

First of all, our population is slowly growing out of our supply of housing in Thurston County and we aren’t producing enough to keep up.

Since 2012 we’ve only built 6,000 housing units in the county, while our population has increased by 20,000. Obviously, more than one person is going to end up living in each unit. But our ratio of person to housing unit has also changed from 2.34 to 2.39. Still slow, but it is going in the wrong direction.
When we look out how we’re building housing, we’re still very much depending on expensive single-family homes. Only once since 2012 did the number of multi-family units come close to single-family units. In 2016 over 900 multi-family units were built in Thurston County, while over 1,000 single family units were. In most other years, single family-units outstripped multi by at least three times.

At the same time, we’re seeing a drop in housing affordability, especially for first time home buyers. The current condition for first time home buyers in Thurston County is already dire, well beneath what would be considered affordable overall. 
According to the Rustad Center, this means that a household earning 70 percent of the median household income (like first time home buyers) had only 67 percent of the income required to purchase a typical starter home in Thurston County. The starter homes that exist are unaffordable for people that would otherwise buy them. This is notable because (as has been pointed out elsewhere), proposals like the Missing Middle in Olympia is aimed at buyers between 80 and 120 percent of median income. While 80 percent is not 70 percent, it sure does get us closer than single-family homes that are much more expensive than low-density multi-family homes. 

What happened after we downzoned and the middle went missing in Olympia?

In the last post I showed how a series of zoning changes in the 1980s and 1990s

But Olympia continued to grow. Where did all those people move?

It seems obvious to point out, but they moved it mostly single-family zoned neighborhoods.

More people came to Olympia, so if we weren’t getting denser, we sprawled. This map shows every parcel that had a new structure in residential type (even including multi-family) after the 1988 downzone. I pieced it together from a series of webmaps from the Thurston Geodata Center.

Instead of densifying the places where we’d already built, we expanded our footprint over the last few decades, cutting down more trees, paving over more open land. People continued to move into town, and as our interior neighborhoods “stabilized,” new neighborhoods continued to be cut out of the woods and farms around Olympia.

Here is the Google engine timelapse from 1984 to today, you can see the exact same thing.

Southeast Olympia:

Westside:
 

I hope this doesn’t really need pointing out, but if we’re worried about the impact of new growth or preserving natural resources, we would be concerned about sprawl. Again, not new news guys.

From City Observatory:

Cities incur substantial expenses to build roads, transit systems and parks to enable development in a neighborhood. Downzoning automatically increases the per capita costs of all of those investments, because each road, park and bus line can serve fewer people. It also pushes additional development to the urban fringe, where some municipality must build entirely new infrastructure at high cost, and where not incidentally individual households will have to drive more, creating more pollution and congestion plus incurring more transportation costs. Ultimately, downzoning is a recipe for more sprawl: if you can’t build as many apartments, you’ve got to build more single family homes, and you’ll end up consuming a lot more land in the process.

Even if the new roads and utilities we used to enable the post-downzone sprawl was paid for at one point with impact fees, we designed a system to fail. The impact fees only pay for the initial setup of these road and utility systems. Eventually, they’ll reach the end of their useful lives and we’ll have to pay to replace them. At that point, we’ve cooked into our zoning a limit on how many taxpayers will be on the hook to replace them. We’re essentially pushing the expense of low-density, unwalkable single-family neighborhoods onto the next generation.

When Olympia downzoned and gentrified

In the early 1960s and through the 1970s, most of Olympia’s residential neighborhoods allowed housing types that are now included in the city’s Missing Middle proposal. The most common of these zones was the RD (Duplex) zone that allowed for single-family homes and duplexes in the same neighborhood. In various generations of Olympia zoning codes, this later became known as R2 and then R 6-12 (meaning six to twelve dwellings per acre). 
In an earlier post, I pointed out how Olympia (and Thurston County) saw its largest influx of new residents in the late-70s. Even the yearly migration of today does not match the spike in new residents between 1977 and 1979. Before and during the 1970s, the construction of 2-4 unit housing pretty much tracked with population growth in Olympia, but in the early 80s, they became unhinged.

This is because Olympia downzoned a series of once density friendly neighborhoods, pushing new growth into largely single-family home zoned neighborhoods on the fringe of the city.

Through the 80s and 90s and to today, the city decreased to the area duplex-friendly zoning covered. This led to examples of places where duplexes had been built, but they weren’t actually technically allowed by the zoning rules. In fact, because of persistent downzoning in recent decades, there are literally hundreds of examples of non-conforming missing middle housing throughout the city. 
According to the city’s tally, there are over 200 non-conforming duplexes, 462 non-conforming tri/fourplex units, and 89 non-conforming 5-12 unit apartments. All of these were allowed under zoning rules when they were built, but the rules changed over time.
Here is a great example of two non-conforming duplexes at Legion that were allowed in 1978, but not a few years later:

It’s worth your time to watch how the zoning maps changed over time. In 1962, the Eastside duplex zone stretched from Eastside up to McCormick.
Then twenty years later (as R-2 zoning), it became much smaller, stretching only to Boundary.

In 1994 it expanded again, but..

It (this time as R 6-12) shrunk back down in 1995 through to today.

We can see the same thing on the Westside. The duplex zone dominated most of the hillside over there in the 1960s and 70s.

Then in the early 80s, the zone shrunk as most of the area downzoned.

And, again in 1994…

But in 1995, the area for duplexes expanded again, taking back a bit of what it used to be.

The most interesting downzone example was in 1988 when the city, downzoned a portion of each of these neighborhoods from a zone that would allow duplexes to a single-family home only zoning. 
There is nearly zero coverage of the 1988 downzone, the only real reference I found to it was in the city minutes. It seems odd to me that of the 18 people that testified on the downzone, 13 were against it. Despite the opposition, the massive downzone went from the planning commision to approval by the city council in four short months.
Here is a map of the downzoned areas:

According to the ordinance, the reason for the downzone was to align the zoning in those neighborhoods with this policy in the then Comprehensive Plan: “Older neighborhoods which are predominantly single family should be zoned single family to encourage home ownership and rehabilitation.”
In terms of how people remember downzones of that era, this checks out. Here is Jim Keogh talking about the Eastside:

The neighborhood stabilized. It became nicer. It also (seemingly) became more expensive. 

Taken from a different perspective, what happened to the Eastside is called gentrification. 
Jim doesn’t really go into why this would happen, but it seems like once you stop allowing more residents to move into a neighborhood and make housing the more exclusive, the neighborhood becomes more gentile genteel.
The result of this sort of zoning experiment would be a mystery if we haven’t seen it play out on a grand scale across the country. For example, Los Angeles conducted this sort of downzoning writ-large over the same timescale as Olympia:

The city of Los Angeles has tested this theory by downzoning
the city to permit fewer dwellings. In 1960, the city was
zoned to support 10 million people. By contrast, today the
city is zoned to support only 4.3 million people — just slightly
more than its current population. So if excluding housing made housing cheaper, Los Angeles
land prices would have fallen, causing rents to fall. And
yet rents, adjusted for inflation, have risen by 55 percent,
while median renter income has grown by only 13 percent. Rather than declining, land prices quintupled, from just over
$86,229 per house in 1984 to $483,692 in 2014.

Less access to housing over a finite area leads to a higher cost to access that housing. Seems pretty simple. The purpose and the result of the downzoning in Olympia was the gentrification that we’ve seen over the last few decades. Rather than allowing the neighborhoods to absorb the growth that was coming, we allowed it to do something totally different.

A short history of why conservation districts hold elections the way they do

One of the oft-repeated observations over the last few weeks as the drama surrounding the Thurston Conservation District has unfolded is that conservation districts are weird in how they run their elections.

It is head scratching that conservation districts, unlike every other form of government (including major parties who elect precinct committee officers), run their own elections. This results in seemingly low-rent affairs that include needing to drive to Tumwater to old school drop a ballot in a ballot box.

The history behind why conservation districts hold their own elections goes back to the formation of the districts in the late 1930s. This is when the Dust Bowl spurred Washington state to first allow their establishment.

Conservation districts aren’t the only special districts in Washington, they’re just the type that we’re currently worried about. And, it turns out, they aren’t the only ones exempt from the general election laws, but those other districts (like drainage and diking districts) still require that a voter also be a landowner (therefore a property taxpayer) in the district).

Sidenote: Someone can correct me on this, but it seems like most of the special districts are rural in nature. I mean, they seem like they’re created to address some specific aspect of rural life or commerce.

Conservation districts strayed from that landowner provision throughout the years, it seems almost by mistake. The best way to explain it would be to understand how landowners in a neighborhood pay for a new sidewalk or sewer line if the city can’t or won’t pay for it. They petition for and form a local improvement district, and tax themselves for the improvement.

When conservation districts were first formed in 1939 only landowners could vote in their elections.  The federal government sent down a model state soil conservation act in 1937, and after Washington adopted ours, the Palouse took no time to form their first district in October 1939.

The mood of this article pretty much gives you what you need to know.

“Palouse men.”

Conservation districts were not general governments. They were somewhere between all the other sort of special districts that had and were already allowed that provided services to specific needs (irrigation districts, diking districts) and general purpose rural organizations like granges.

The law changed in 1973 to allow “land occupiers” to vote, seemingly to allow people who were leasing land or otherwise using it to also vote.

And then in 1999, the law changed again to allow for any registered voter to vote for conservation district supervisor. It is important to point out that according to the legislative record, this was totally by accident. HB 1747 was passed in 1999 to create a way for cities to leave conservation district boundaries. There were concerns about overlapping programs, so cities wanted a way out. To shoehorn in the petition process that a city would use, they put in a reference into the conservation district laws to “registered voters” instead of “land occupiers.”

 And this is when it all got very janky in regards to all registered voters.

For a hot second, the Attorney general said that those references meant that conservation districts were covered under the general election law.  The conservation district elections in 2001 were handled by county auditors, like most other government elections. Because local governments have to pay a prorated amount for their participation in an election, if conservation districts didn’t hold their elections with a lot of other jurisdictions, it became very cost prohibitive.

So, with the support of a lot of organized agricultural interests in 2002 (Farm Bureau and the Dairy and Cattlemen’s associations), the legislature voted to leave in the part where they allowed any registered voter to participate. But they also clearly reverted to the old rules of conservation districts being able to run their own elections without the county auditor.

In 2002, this wasn’t so transparently a big difference because Washington had not yet changed over to an all-mail system. But it seems very odd now.

So, in short, it has always been that way, but the rules changed over time to allow for more participation, but also not deliberately. It costs less to do it this way and at a point when the legislature could have made conservation districst play by the same rules, they decided not to.

When middle went missing in Olympia

At some point, Olympia stopped building low-density multi-family housing.

In older neighborhoods, you can find duplexes courtyard and mansion apartments dotted along blocks. Even in blocks built in the 1960s and 1970s,

you can see duplexes interspersed between single-family homes.

But as you get into newer neighborhoods, it is harder and harder to find examples of affordable, low-density multi-family housing. I can show you when this happened, but I can’t show you why.

EDIT 10:18 a.m.: Ignore that chart down below. It isn’t detailed enough. This chart really shows a population spike in Thurston County in the mid-70s and how low-density multi-family housing tracked with migration until the 1980s. Then they became untethered.

What this chart shows you is the population of Olympia by decade plotted against the construction decade of structures with two to four housing units (Use Code 12). This would cover anything from a duplex to a fourplex and some kinds of smaller apartment buildings. I think this use code is a good stand-in for what we now call the Missing Middle in Olympia.

It seems like that for most of Olympia’s history, the construction of these low-density multi-family buildings pretty much tracked with population growth in Olympia. But in the 1970s they took off, far outpacing population growth. And, then construction of these units crashed and never recovered.

Because the above data is aggregated by decade, it looks like most of the growth is happening in the 1970s. But if you look at it in more detail, you see something else happening.

Multiplex housing spiked in the mid to late 1970s and then crashed in the early 1980s. While there have been spikes in construction since then, it never really recovered to even the levels that we saw after World War II. The boom in the late 1970s and crash in 1980 coincides with the boom in migration into Olympia and the early 1980s recession that stopped it. The late 1970s still stands as the largest ever influx ever of new residents into Thurston County.
I’d like to chase down exactly what happened to low-density multi-family housing after the 1970s. Based on my post last week and the numbers I’m seeing here, it seems like that at some point after the early 1980s recession that slowed migration Olympia, we changed our zoning laws to clamp down on duplexes. Then we likely experienced a few decades of slower growth where we exacerbated the ends of our housing options (single family homes and multilevel apartments).

How the history of our neighborhoods points to our Missing Middle past

At one time in Olympia, and most other cities, neighborhoods grew one house at a time and they grew with different needs in mind. Mixed-density housing was prevalent prior to World War II and was exactly the kind of development that originally encouraged walkable neighborhoods. 
The Carylon neighborhood is a great example of this. A month ago I took a look at a duplex in Carlyon that I was interested in renting. It was a bit outside my price range at the time, and to be honest, I was surprised it was even available in that neighborhood.
Because it shouldn’t have been allowed (yellow means no duplexes under current zoning):
Also interestingly, I thought that it was a single family house that had been split into a duplex, but I researched the history of the structure, and it had always been a duplex. 
And, it turns out, that one duplex was not as rare as I thought in Carlyon. The map below shows the different use codes for the buildings in the neighborhood. Red is single family homes, purple are duplexes and blue are apartments:
There are not only duplexes spread throughout the neighborhood, there are even a couple of small apartment buildings. This shows how Carlyon, before zoning in our neighborhoods became more restrictive, was able to provide housing for residents across the economic spectrum.
There is a section of the Bigelow Neighborhood that is also a good example of this:
While still mostly single family homes, these neighborhoods have a decent mix of middle-density housing options. And, a lot of it is illegal under current zoning. That if we tried to build a lot of the housing now available in these neighborhoods, it wouldn’t be allowed.
And, I don’t think anyone can say that these sections of Olympia are unlivable. All in all, they probably represent some of the most economically accessible, livable and walkable neighborhoods we have. And, this is no small part because of the diversity in housing options they offer.

And, they also represent a way of building homes in this city that we don’t have anymore because of the restrictive way our zoning works. The traditional manner of regulating neighborhoods was to allow for a diversity of housing types on a block. The way we do things now, with restrictive zones that allow for very few housing types in neighborhoods, is relatively new and experimental. It is also, in my opinion, largely unsuccessful. It has created neighborhoods that are economically stratified and car-dependent.
It wasn’t until after World War II that a single developer would take on building all the homes in a neighborhood, which cut down on the diversity of home types.

In this next map, you can really see how the houses were built in the Carlyon neighborhood over a long period of time. It took several decades for this neighborhood to transition from a former cattle ranch into a residential neighborhood. When it was making that transition, it was part of neither the city of Olympia or Tumwater. In fact, it was the uneven development of the neighborhood that gives it it’s most unique characteristic, the jumpy city border between Olympia and Tumwater. But that is more trivia than something underlying my bigger point.

While diversity is present in the neighborhood I live in, Briggs Village in Southeast Olympia, my neighborhood is the exception that proves the rule. Diversity isn’t usually a mark of planned development. The helter-skelter of the market historically has allowed builders to offer what was needed on a neighborhood scale when they were able to sell it. 
This incredible story at Sightline shows how single-family zoning became more prevalent over time in Seattle, that neighborhoods at one point had been able to be fitted with more than one sort of housing option. While the Missing Middle recommendations we’re considering in Olympia now are not an up-zone, the city of Seattle conciously downzoned most of the city in the 20th century, outlawing options like townhomes and neighborhood scale apartment buildings.

It’s time to acknowledge how messed up the Thurston Conservation District is and you should vote to change that

This is not the blog post you were looking for if you’re looking for the entire story behind what’s going on at the Thurston Conservation District.

I’ve been hearing about this on-going train wreck of a story through second-hand accounts and snippets I could find in the official record for months. And there is totally enough here for a real reporter to dig into. And I’ve been hoping for the adults in the room to take over.

But, in the last few weeks, the district dumped a bunch of draft meeting minutes onto their website, giving a more complete picture of the dysfunction over at the TCD. So, I’m going to take a shot at giving you a picture of what’s going on.

Also, Dani Madrone and I will interview Joel Hansen, an associate (non-voting) board member of TCD, on The Olympia Standard at the end of this week.

Lastly, while there is some diagonal overlap between my professional work and this topic, this blog post in no way represents the opinions of anyone I work for. It’s all me.

Here is the too long, didn’t read of the situation: somewhere in the last year, the board of the TCD decided they wanted to change how they funded most of the functions of the district. This is a complicated process in the best of times. But in the meantime, they decided to not re-up the method of funding they did not prefer (as assessment) while they prepared the new method (fees and charges system). Actually, the new system wouldn’t even be submitted to Thurston County until May of this year, at best. So, as of January 1, the district lost 40 percent of its funding. Additionally, the dysfunction on the board (which you can read about below) has further slowed the process. Because these obviously aren’t the best of times for TCD.

Some state-level organizations have taken notice of what is going on. The state Recreation and Conservation Office (which works with TCD on salmon recovery projects) shot off a letter basically telling TCD to stay in their lane.

The state Conservation Commission, which oversees all local conservation commissions, began threatening consequences in November if the dysfunction didn’t tamp down.

So, what dysfunction?

Here’s the bullet list put together by the state conservation commission in the letter linked to above:

The state Conservation Commission has the power to remove board members of local conservation districts and will at least start considering removing board members from TCD soon. The state commission recently gave their executive director the authority to “issue a notice of a hearing to each supervisor of the Thurston Conservation District regarding removal of supervisors under RCW 89.08.200.”

One example of board members behaving badly is described by  one of the staff members from the State Conservation Commission when he laid into the board during the November 21 meeting:

Another is a how the board has been limiting public comment, seemingly to people they like. 
During their December meeting, the board allowed one member of the public to take up all five minutes of public comment. That’s all they had allotted, five minutes. And, if one person took it all up, then everyone else would have to give it in writing. Now, it really is up to a board of a commission how they handle public comment. But there’s an issue of fairness here. If you only have five minutes, then why let one person take it all? And, if you’re going to let one person talk, then why not let other people get up and talk? Most local boards I’ve either served on or witnesses allow anyone to come and speak, but they’ve put a limit on the individual speakers’ time. Anyway, as you can see from below, this didn’t go over well.
From the December board meeting minutes:
In this particular meeting, the board ended up relenting, but it still looks pretty bad that people from the audience had to essentially shame them into letting everyone talk. It is worth pointing out that the one person they did allow to step up and speak (Joe Hanna) has had at different times interjected into board discussions during the meeting. Also in my experience, this isn’t a normal practice either.
Also, apparently, no one at the conservation district was signing checks so they weren’t even paying rent (again from the December meeting):

So what you can do right now to voice your desire for change at the conservation district is vote before March 3. The last day to request an absentee ballot is February 28.

There’s an open seat on the board which is being filled by probably the weirdest election you’ll ever vote in. There’s no mail-in ballot, you have to work directly with the conservation district to vote. It used to be that you had to go to the district office, but now you can go online and directly request an absentee ballot.

The League of Women Voters are also holding a forum tonight on Tuesday, February 13 for several of the candidates.

What would it mean for the nature of our city that the Missing Middle would have the biggest impact on Southeast Olympia?

Southeast Olympia is already wealthy and conservative. Would allowing more housing types down there change that?
The above map is a mashup of two different maps. 
The first is a parcel density map of where the Missing Middle recommendations would have the greatest impact. It shows where the buildable parcels left to be developed match up with the potential for Missing Middle housing. For those just showing up, Missing Middle is the variety of housing between an apartment and a single-family home, such as a townhouse, duplex or courtyard apartment.
The second map (which is displayed in white to red placemarks) is the election results from the Lisa Parshley vs. Allen Miller race last November. Miller districts (more conservative) are lighter, Parshley districts (more progressive) are darker.
Now, this isn’t an exact science but what this map tells me is that the neighborhoods with the greatest potential for growth from Missing Middle housing are far more conservative.
To me, it totally follows that neighborhoods that are less dense, with bigger yards and longer commutes, would be the more conservative. And, it turns out, much wealthier.
This next map is a selection of a map that shows how income really is distributed across the city. Some of the wealthiest parts (here in deep red) are in the same sections, down in the Southeast side of town where Missing Middle is hard to find, but the potential is the greatest.
So, imagine a scenario where Missing Middle housing becomes available across the broad swath of Southeast Olympia. What happens to the grassy, large single family home dominated section of Olympia? Does it become more progressive? Does it become more egalitarian? 
« Older posts Newer posts »

© 2025 Olympia Time

Theme by Anders NorenUp ↑