Brier Dudley’s recent column, “No wonder election results are wacky: Fewer follow the news,” carries significant weight in Washington State. As a leading voice in the movement to fund news organizations, Dudley often frames the boundaries of what policymakers consider possible for future public funding of journalism.
However, his latest diagnosis of our “wacky” election results rests on a fundamental misunderstanding of how voters actually behave and where they are finding their signal in the noise.
Dudley’s thesis is that a lack of news consumption leads to “civic illiteracy” and “wacky” results, such as the election of progressive Katie Wilson as mayor of Seattle. But on his way to create a thesis that builds support for local journalism, he ignores the basic calculus of voting. Voting is an opt-in activity.
In political science, this is called “information efficacy”: the belief that you know enough to make a choice. People who truly feel uninformed don’t typically cast “wacky” ballots; they don’t cast ballots at all. This “voter roll-off” is why local turnout is often a fraction of national turnout. If someone shows up to vote for a “neophyte,” it’s rarely because they are operating in a vacuum. It’s because they have consumed media, be it a TikTok breakdown, a thread on X, or a digital endorsement, that gave them the confidence to act.
The Seattle Blind Spot
Also, if Dudley’s thesis were universally true, Seattle would be a strange place to prove it. He laments the decline of newspapers and TV, yet ignores the vibrant, digital-native ecosystem that currently drives Seattle politics.
While the Seattle Times remains a vital institution, it is not the only game in town. The city continues to fund public television; KUOW is a massive, robust newsroom; and then there is The Stranger. Whether one agrees with its politics or not, The Stranger remains a primary driver of city elections. When “neophytes” win, it is often because they were vetted and promoted by these alternative local outlets. By ignoring these players, Dudley isn’t describing a news desert; he’s describing a landscape where daily newspapers no longer hold the only map.
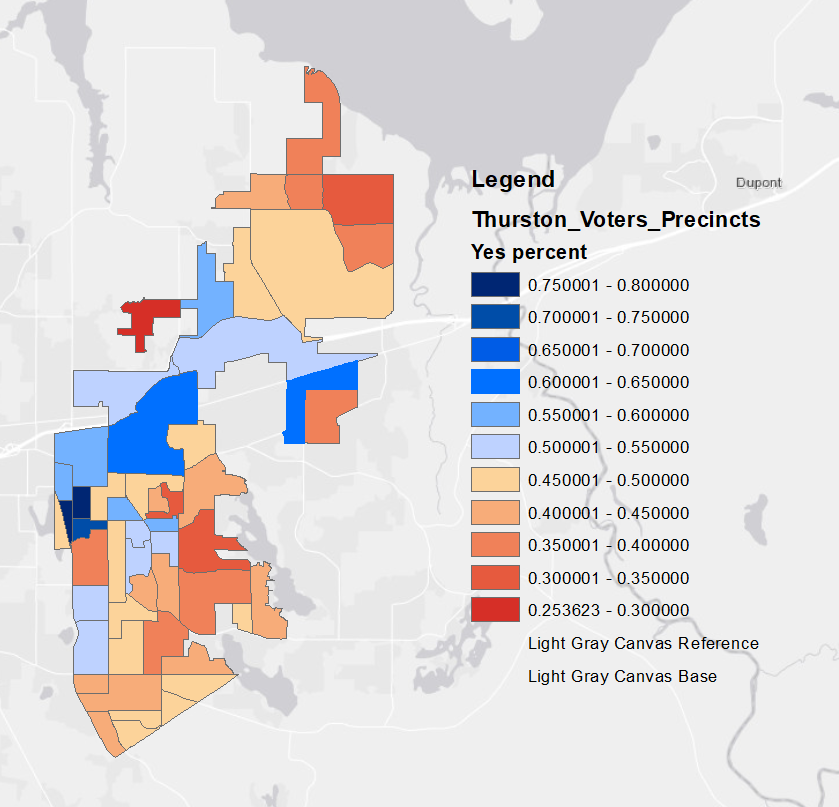
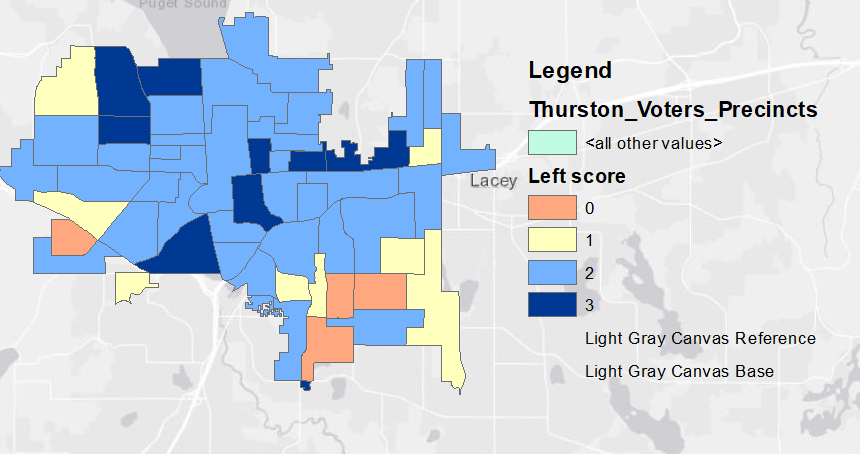
Olympia and Thurston County are a better example of the news desert that Dudley wants to use. The election results here, though, don’t match the results of his thesis. Rather than “wacky,” we tend to elect local leaders who stand in the deep trough of our local version of centrism. This is because the voters who tend to opt in have the time and inclination to do the extra work to research their choices. This is not an argument for less information. A broad and informed public is obviously a good thing for electing good leaders, but ensuring that once they are elected, they do the right thing.
“Social Media” Doesn’t Mean What You Think It Means
Dudley, like many, uses “social media” as a catch-all for “no news” or “unfounded opinion.” However, by 2025, telling a researcher that you get your news from social media is a meaningless data point. It doesn’t tell us what you are seeing. Are you following KUOW’s journalists on Mastodon? Are you watching live-streamed City Council clips on YouTube? Or are you reading a post from your neighbor on Nextdoor?
Social media is a delivery mechanism, not a source. The problem isn’t that people are “on social media.” The problem is that we have outsourced our civic square to attention-seeking algorithms.
Credibility is Now Built on Engagement
We cannot recreate the 1995 newsroom. The back-and-forth between media and audience has opened up permanently. Today, credibility is built on engagement, not just clicks to a paywalled article, but the actual work of being present where people are.
However, we must admit the anti-democratic force of current algorithms. Most platforms optimize for outrage because outrage pays more. This is fundamentally different from a newspaper’s old role of setting a shared civic agenda. We don’t just need people to come back to paywalled websites; we need a next way that fixes the digital architecture itself.
The Next Way: Digital Public Spaces
What does a pro-democracy digital space look like? It looks like an algorithm that benefits the community by not stoking outrage, and moderation systems that protect people from harm while inviting debate.
A promising example is Roundabout, a new product from the nonprofit New_Public. Roundabout is designed to revive the civic commons role that local newspapers used to play. Unlike Facebook, it is intentionally built against virality. It organizes local information, events, and shared concerns through structured channels and local stewards who guide the conversation.
Instead of a feed designed to keep you scrolling via conflict, Roundabout creates a digital space meant to help neighbors actually know one another and act together. It prioritizes usefulness over headlines and relationships over “likes.”
Looking back at old newsrooms and tsk-tsking candidates for making social media videos isn’t a strategy for the future. We don’t need to save the press of the past; we need to build a digital commons that treats us like neighbors and citizens rather than data points for an outrage machine.