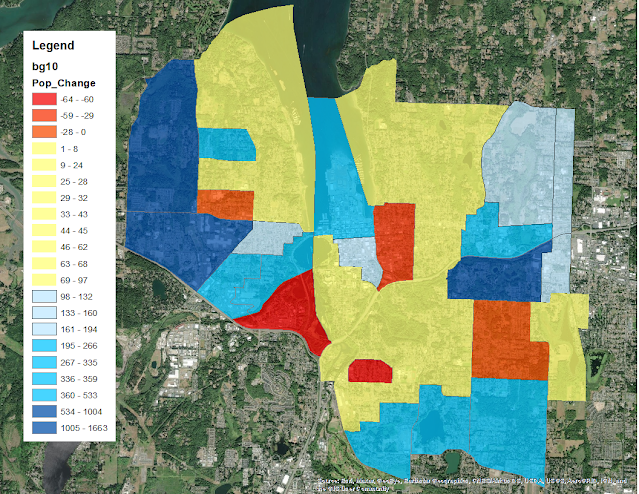
Olympia’s neighborhoods saw varying patterns of population growth and contraction over the past 10 years.
Olympia grew by almost 10,000 residents and Thurston County as a whole grew by over 40,000 in the 2010s. Obviously, population growth is not evenly spread across the county. But it is amazing to see that while the population of our community grows, there are neighborhoods so walled off by exclusive zoning, that they were able to fend off this growth.
I’m convinced that the slow and declining growth in population in these neighborhoods is the on-the-ground impact of exclusive single-family zoning. After years of work, Olympia finally passed zoning rules at the end of the decade that ended this kind of zoning.
You can see below that the story isn’t nearly as simple as “single family neighborhoods shank/didn’t grow and multifamily neighborhoods grew.” The 2010s did seem to serve as a natural experiment of what the long-term impacts this zoning had on neighborhoods.
Olympia started clamping down on neighborhood multifamily housing (like duplexes and cottage apartments) in the late 1970s. The 2010s were the fourth decade of this kind of enforced low density, and the recently released census data gives us a way to examine its impacts.
Here is the map I ended up with:
1. The vast majority of Olympia grew very little. I colored block groups that didn’t increase more than 100 people in yellow. And, these block groups make up most of this map. While these areas did grow, it is worth noting that they did not grow very much.
2. The neighborhoods that shrank were a mix of housing types. Especially, the two block groups on the Westside include a significant number of apartments. It is worth noting that the apartments and other multifamily zoning there are older structures.
3. Except for downtown, all of Olympia’s growth happened on the edges. For a few block groups, especially on the far east edge of Olympia and on the Westside along 101, this is where a significant number of new apartment buildings are being built. While a lot of attention has been paid to multifamily housing downtown (which has brought in new residents), the real driver of Olympia’s new population are less flashy apartments along the edges.
I wrote more about the apartments being built on the Westside last year, illustrating how multifamily housing on the edges of Olympia are driving racial segregation.
A few notes on how I did this work:
- I did a similar examination a couple of years ago using American Community Survey data. While I found similar shrinking neighborhoods then too, the ACS data is an extrapolation of survey data, and is less precise than the census headcount.
- Block groups are just about the narrowest geography you can assess changes in population change across Olympia. I had to cross-walk a few block groups that had broken in smaller pieces. I posted my notes on that in this spreadsheet.
- The data and shape files are the OFM datasets of the recent census release.
- Because I did the cross-walk, the geographies I mapped were the 2010 block groups, since I combined the 2020 block groups.
- The block groups I picked do not line up with the borders of the city exactly. In places where I had to choose, I chose to go over the border of the city.


Emmett,
Nice work on examining the data, producing the maps and graphs and sharing your assessment. Very helpful to see where the growth occurred and where demographics changed. One thing I am observing in my own 'hood is that even though it has historically been zoned multifamily, even during the downzone decades, it has stayed predominately SF and white. I think is largely due to high median housing prices. and desire by homeowners to convert MF structures to SF. As the homeowners in my 'hood age out and sell, I am seeing more diversity in new families. That process takes longer in built out neighborhoods like mine with a tendency for converting MF to SF.
Thank you for producing this great assessment of population trends in Olytown!
Gordon