History, politics, people of Oly WA

Category: vaccine rates

What does a medical exemption from vaccination mean in the Olympia School District?

Measles can be prevented.

Medical exemptions for vaccinations in the Olympia School District and Washington State might not be what they appear to be.

On their face, these exemptions allow children who cannot be vaccinated (because of weakened immune systems, for example) to waive vaccination requirements and attend school. But, from what I’ve been able to gather from a public document request from the Olympia School District, the differences between personal-belief and medical exemptions is murky.

So murky that (please read to the bottom), I wonder if doctors or any medical professionals are necessary for the medical exemption process.

Let’s work backward first to see how I got here:

About a month ago, while the measles outbreak in Clark County was still new news, I updated what the vaccination rate for schools in Olympia was like. This was similar to other times I’d done this update, there are some scary high exemption rates in Olympia schools. But this time I noticed a new wrinkle: the top schools for personal-belief vaccine exemptions were also the top schools for medical exemptions.

Top Medical (bold if on both):

1. Olympia Community School (12.9 percent)
2. ORLA Montessori (8.5 percent)
3. Olympia Regional Learning Academy (6.3 percent)
4. Lincoln Elementary (4.6 percent)
5. Pioneer Elementary (2.7 percent)

Top Personal (bold if on both):

1. Lincoln Elementary (19.4 percent)
2. Avanti High School (17.6 percent)
3. Olympia Community School (16.1 percent)
4. Olympia Regional Learning Academy  (15.8 percent)
5. ORLA Montessori  (15 percent)

To me, this made little sense. If you were a parent of a child who had a medical reason to avoid immunizations, then I think you’d want to then use the herd immunity at your child’s school to help prevent infections. What I could see was that there was a correlation between parents who would seek a personal exemption from vaccines, ones that would seek a medical one, and the school they chose.

That made me assume that parents who are seeking medical exemptions are also not necessarily afraid to send their children into environments where a scarily low percentage of the children are vaccinated. This got me curious about the nature of medical exemptions in the Olympia School district overall.

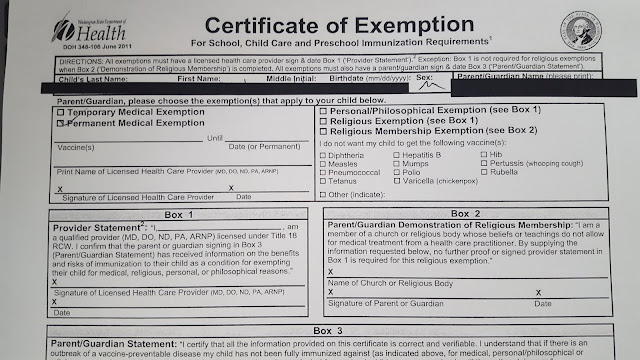
So, I made a public records request for all medical exemption forms that represent active students in the Olympia School District. These are the documents I received and this is the spreadsheet I put together summarizing what I found (folder with both files here). The district blacked out student names and addresses before they gave me the documents, but they didn’t black out the names of doctors that signed medical exemptions.

Here is what I sussed out:

1. Naturopaths are slightly more likely to sign medical exemptions. While 25 percent of the medical exemptions I received from the school district, naturopaths only make up 20 percent of the provider types (family, pediatric and naturopath) that I assume would likely be presented with the form. Some forms were also signed by physician assistants and nurse practitioners.

2. Some doctors sign more than others. Like schools that seem to collect medical exemptions, some doctors seem to sign more than their share. This may be a consequence of who they see (people that are more willing to ask for a medical exemption), but I will probably never find that out. While a vast majority of the doctors who signed the forms only signed one, there were a few that signed several:

Jennifer Ash ND, 7
Lisa Barer MD, 6 

Amy Belko MD, 4
Bridget Sipher MD, 4
Kevy Wijaya MD, 4
Richard Faiola NP, 4

3. What does a medical exemption even mean? Over 75 percent of the forms had both the “medical” box and “personal” exemption marked on the form. This seems to undercut the meaning of the medical exemption form altogether. What may seem like an inexplicable bunching of both medical and personal belief exemptions (why would an immune deficient child attend a school full of unnecessarily unvaccinated children?) isn’t. What it really could be is just a larger group of children whose parents declined vaccination for personal beliefs but got their doctor to sign a medical waiver.

Then there was this:

You might have already perused the documents the school district gave me, but if you haven’t, this is (as far as I can tell) a full-on medical exemption form with no details, exempt the student’s name and a parent’s signature. No medical professional’s name, no medical professional’s signature. This isn’t even a double-marked personal/medical exemption. This is a pure medical exemption that is on file at the Olympia School District, that purported to clear a student to have not been vaccinated for medical reasons, with no medical professional’s name on it. 

If a parent can sign a medical exemption form and it be accepted by the school district, what is the point of even requiring them at all?

Your semi-regular update on what schools have low vaccination rates around Olympia

Usually, about when there is something in the news about an outbreak around here, I’ll go to the state Department of Health and find out what the vaccination rates are at our local schools (and here). This time around, there is a measles outbreak just about an hour south of us, so I thought it would be nice to narrow in specifically on exemptions (personal, religious or health) for the measles, mumps, rubella vaccination.

According to the most recent data, there are a handful of schools in the Olympia area with fairly high exemption rates for the MMR vaccine.

School Percent exempt for measles, mumps, rubella Percent with any personal and religious exemptions (not just MMR) Percent with medical exemption (not just MMR)
OLY REGIONAL LEARNING ACADEMY 16.2% 22.1% 6.3%
ORLA MONTESSORI 15.5% 23.5% 8.5%
OLYMPIA COMMUNITY SCHOOL 12.9% 29.0% 12.9%
LINCOLN ELEMENTARY 12.7% 24.0% 4.6%
GRAVITY 12.5% 12.5% 0.0%
AVANTI HIGH SCHOOL 12.0% 19.0% 1.4%
Paramount Christian Academy 9.1% 9.1% 0.0%
TUMWATER WEST 9.1% 9.1% 0.0%
NOVA SCHOOL 8.6% 10.5% 1.0%
PIONEER ELEMENTARY 5.9% 10.6% 2.7%
BLACK LAKE ELEMENTARY 5.7% 7.7% 1.7%
REEVES MIDDLE SCHOOL 5.1% 13.6% 2.0%
MICHAEL T SIMMONS ELEMENTARY 5.0% 6.7% 1.4%
THURGOOD MARSHALL MIDDLE SCHOO 4.9% 8.2% 1.8%
BOSTON HARBOR ELEMENTARY 4.7% 8.3% 2.4%
ROOSEVELT ELEMENTARY 4.6% 7.2% 1.7%
GARFIELD ELEMENTARY 4.6% 9.9% 2.2%
EVERGREEN CHRISTIAN SCHOOL 4.4% 7.8% 0.0%
TUMWATER HIGH SCHOOL 4.1% 6.5% 0.8%
NEW MARKET HIGH SCHOOL 4.0% 4.0% 0.0%
EAST OLYMPIA ELEMENTARY 3.9% 5.5% 0.4%
MARGARET MCKENNY ELEMENTARY 3.9% 4.2% 0.0%
OLYMPIA HIGH SCHOOL 3.9% 9.6% 0.3%
JEFFERSON MIDDLE SCHOOL 3.9% 6.6% 0.9%
CENTENNIAL ELEMENTARY 3.7% 5.4% 1.1%
BLACK HILLS HIGH SCHOOL 3.7% 6.4% 1.5%
CAPITAL HIGH SCHOOL 3.7% 7.0% 0.6%
PETER G SCHMIDT ELEM 3.7% 4.5% 1.0%
GEORGE WASHINGTON BUSH MS 3.5% 6.7% 0.6%
LITTLEROCK ELEMENTARY 3.1% 4.5% 1.4%
SOUTH BAY ELEMENTARY 3.1% 4.1% 1.0%
TUMWATER MIDDLE SCHOOL 3.1% 5.0% 1.0%
TUMWATER HILL ELEMENTARY 3.1% 4.2% 0.5%
WASHINGTON MIDDLE SCHOOL 2.8% 6.3% 1.0%
LACEY ELEMENTARY 2.8% 3.6% 0.8%
OLYMPIA CHRISTIAN SCHOOL 2.6% 10.5% 0.0%
LYDIA HAWK ELEMENTARY 2.5% 3.1% 0.2%
MEADOWS ELEMENTARY 2.4% 2.8% 1.0%
SOUTH SOUND HIGH SCHOOL 2.4% 3.0% 0.0%
SECONDARY OPTIONS 2.4% 3.9% 0.8%
OLYMPIC VIEW ELEMENTARY 2.3% 2.5% 0.9%
NORTH THURSTON HS 2.3% 5.8% 1.4%
NORTHWEST CHRISTIAN HIGH SCHOOL 2.3% 2.3% 0.8%
CORNERSTONE CHRISTIAN SCHOOL 2.2% 2.2% 0.0%
JULIA BUTLER HANSEN ELEMENTARY 2.2% 2.2% 1.1%
MADISON ELEMENTARY 2.1% 5.4% 0.0%
GOSPEL OUTREACH 2.0% 2.0% 0.0%
HORIZONS ELEMENTARY SCHOOL 1.9% 2.6% 0.9%
L P BROWN ELEMENTARY 1.8% 2.4% 0.3%
COMMUNITY CHRISTIAN ACADEMY 1.8% 3.0% 0.0%
ST. MICHAEL SCHOOL 1.7% 3.5% 0.9%
KOMACHIN MIDDLE SCHOOL 1.7% 3.5% 0.9%
TIMBERLINE HIGH SCHOOL 1.7% 3.4% 0.4%
CHAMBERS PRAIRIE ELEMENTARY 1.7% 3.3% 0.7%
NISQUALLY MIDDLE SCHOOL 1.5% 2.7% 0.7%
WOODLAND ELEMENTARY 1.4% 2.2% 0.3%
RIVER RIDGE HIGH SCHOOL 1.4% 3.2% 0.5%
SALISH MIDDLE SCHOOL 1.3% 2.3% 0.7%
ASPIRE MIDDLE SCHOOL 1.2% 4.9% 0.0%
EVERGREEN FOREST ELEMENTARY 1.2% 2.8% 1.2%
HOLY FAMILY SCHOOL 1.2% 1.2% 1.2%
POPE JOHN PAUL II HIGH SCHOOL 1.1% 1.1% 0.0%
MCLANE ELEMENTARY 1.0% 2.3% 1.3%
CHINOOK MIDDLE SCHOOL 0.9% 4.0% 0.9%
MOUNTAIN VIEW ELEMENTARY 0.8% 2.0% 0.5%
PLEASANT GLADE ELEMENTARY 0.7% 1.7% 0.7%
SEVEN OAKS ELEMENTARY 0.7% 2.0% 0.2%
NEW MARKET SKILLS CENTER 0.3% 0.3% 0.0%
TOUCHSTONE SCHOOL 0.0% 0.0% 0.0%
CAPITAL MONTESSORI SCHOOL 0.0% 0.0% 0.0%

Here is the most recent data from the state and the spreadsheet I used.
What leaves me scratching my head about this data is that when you parse out the medical and personal exemptions, they seem to follow the same general pattern. Schools with high personal/religious exemptions also have high medical exemption rates. 
When I first started looking at this stuff, I assumed medical exemptions would be evenly dispersed across the area. It follows that since all of the schools that have high exemption rates are schools you either generally lottery into or opt into, that the personal/religious exemptions would gather there.  In the same way that opting into certain schools is an expression of a family’s choice, so is opting out of vaccination. But the medical reasons for not being vaccinated, I don’t think, would be more general and would not necessarily be tied to a family’s school choices.

If you’re new to this issue or just need some background, here is some information you might find useful:

Here is an explanation on how those exemptions work.

You’ve heard about herd immunity, or how the vaccination rate in a group of people that protects people who can’t receive a vaccine. This is why a 16 percent exemption rate at ORLA or a 12 percent exemption rate at Lincoln are sort of scary.

According to the CDC, an immunization rate of 94 percent is necessary to prevent pertussis from persisting in a community. That is above the 88 percent that the exemption rate at Lincoln would indicate is that school’s immunization rate.


How Olympia’s schools rate for immunization rates and why Lincoln is a good candidate for whooping cough

With the pertussis (whooping cough) outbreak at Lincoln Elementary, it’s time to take another periodic deep dive into vaccination data for Olympia School District.

The last two times I’ve written about this I’ve done much higher altitude views, comparing Olympia and Thurston County to other areas. Now I want to take a deeper dive into the information, and go school by school. The state Department of Health provides data on a school by school basis.

So, I took that data and began cutting it up into smaller pieces. Here’s what I was working with.

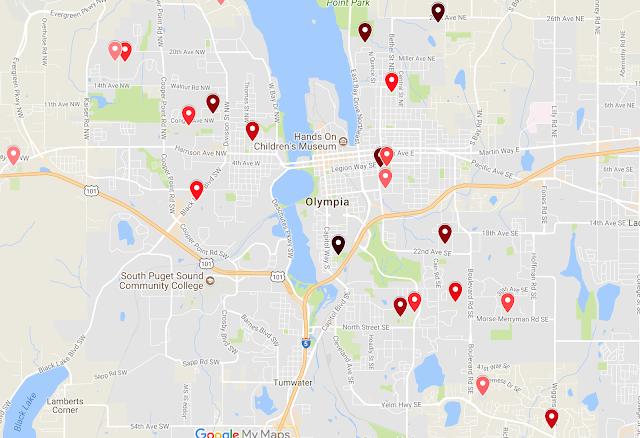
That last spreadsheet is where I came up with this map:

This is a map that plots non-medical immunization exemptions on file at each school with more than 100 students by rate. No surprise, Lincoln is top of the list. It also isn’t that big of a surprise then that Lincoln is near the top of the schools with exemptions specifically citing pertussis at 12 percent.


Here is an explanation on how those exemptions work.

If you’re somewhat aware of this issue, you’ve heard about herd immunity, or how the vaccination rate in a group of people that protects people who can’t receive a vaccine. This is why a 12 percent exemption rate at Lincoln is sort of scary.

According to the CDC, an immunization rate of 94 percent is necessary to prevent pertussis from persisting in a community. That is above the 88 percent that the exemption rate at Lincoln would indicate is that school’s immunization rate.


Why does Olympia have a low immunization rate?

A couple of years back I was shocked (shocked!) at the high rate of immunization exemptions in Thurston County and especially the Olympia School District. Back then the state had just passed a law where parent’s have to more expressly say why they’re exempting from immunization. Apparently that extra social hurdle has worked in Thurston County.

While the countywide trend has gotten back to the statewide average, it looks like Olympia still stands out like a sore thumb in the county. All of my data came from here.

County rates are coming down:

Olympia still out there:

Cascadia is known for its high rates of people who don’t like giving their kids shots (for whatever reason), but there’s been very little explanation of why. Some people pointed to that in Washington it had been easy to get out of immunization. But, that has changed, and the rates are still pretty high.

What if there is a broader social culprit? I’d say its possibly a cause of how people on the ends of either the left or right liberal slant (traditional political spectrum) don’t necessarily feel the social pressure to conform to something getting immunized. The Inlander piece I linked to earlier points out that homeschoolers and religious schools have some of the highest rates of exemptions in 2011. Possibly our social culture of living and let living allows for people to shut themselves off from guarding the public health.

Immunization exemption rates in Thurston County and the Olympia School District (or 41 percent of kindergartners in Ferry County don’t have shots)

This foul-mouthed post on Washington leading the nation in people who don’t get their children immunized made me wonder about the more local data. How many people send their kids to school without the right shots, thereby making it more likely that not only will their kids get sick, but the entire school will be less healthy.

Turns out, Thurston County has one of the highest rates of immunization exemptions in the state. Or, the highest number of parents and guardians consciously sending their kids to school without shots.

Here is a map by county, and by school district and a spreadsheet with all the data. Not only is Thurston County a leader, but Olympia School District is in the worst category as well, rating over 10 percent exemptions of the kids entering kindergarden.

By no means is Thurston County on the fringe here, there are some much worse offenders. Like Ferry County, where 41 percent of kids entering kindergarden have signed exemptions in the 09-10 school year. And, that was after the rate increased from 8.9 percent in 2004 to over 50 percent in 2008.

Also, Klickitat County’s rate went from 5.5 percent in 2008 to 21.6 percent in 2009. As the post at the start points out “(t)he national target is 95 percent” immunized.

Here’s a run down on the current situation of how a parent can enroll and child in public school without a full set of immunizations from a legislative staff report:

…a parent or guardian may exempt a child for one of several reasons including if a physician advises against a specific vaccine for a child, parents certify that the vaccine conflicts with their religious beliefs, or parents certify that they have philosophical or personal objections to the child’s immunization.

The staff report is on ESB 5005, which made the following changes to the requirment to be excempt from immunization:

…a parent or guardian must present, to exempt a child from school immunization requirements. The form used to certify the exemption for either medical, religious, or personal objections must include a statement, signed by a health care practitioner, that the parent or guardian has been informed of the benefits and risks of the immunization to the child. Health care practitioners may sign forms at any time before the enrollment of the child in a school or licensed day care.

© 2025 Olympia Time

Theme by Anders NorenUp ↑

×