History, politics, people of Oly WA

Month: November 2023

School board races were much more interesting, and more confusing, this year (Thurston County election maps 2023)

The school board races in Olympia and North Thurston were a lot more interesting than these races usually are. Oftentimes, it seems, competitive school board races are debates are played under the table. Door-belling and interpersonal connections see to matter more than clearly stated policy position and interest-group endorsements.

But, that was before Moms for Liberty, trans-exclusionary policy debates and the issue of police in schools raised the nature of these races.

I have not spent a lot of time dissecting these races after-the-fact. So this is my first real go at it, in my memory. I’ll be especially unsure about how to read the maps for the North Thurston seats, since I don’t really look at Lacey on its own very much.

Olympia School District

The first two maps are for Hillary Seidel and Jess Tourtellotte-Palumbo.

Hillary Seidel in blue
Jess Tourtellotte-Palumbo in blue

Both of these maps are generally the same. Tourtellotte-Palumbo had a thinner margin of victory, so her territory is smaller. But her best precincts are the same as Seidel’s. They both did best closer to downtown Olympia, with their leads fading as they go further out of town.

The interesting map here is the race between sitting board members Maria Flores and Talauna Reed. Reed had been appointed by the board to serve in a westside district, but had moved before filing week to the eastside, so filed to run for the district seat currently filled by Flores. The problem for geography though is that both occupied nearly the same lane politically, with Flores being more towards the center of Reed’s leftward tilt.

Here is Maria Flores’ map:

This is a fairly dominant map, with Reed pulling only four precincts overall.

What is really interesting about the Flores/Reed race was that the voters noticed the crowded left-hand nature and started writing in other names. There were fewer than 130 write-ins in the first two races, but over 800 in the Flores/Reed race.

And those write-ins definitely trended towards where Flores was the strongest. Where voters were more likely to vote for Flores, more of them were also more likely looking for someone else.

This chart is Flores’ raw return against the percent of write-ins:

This chart shows the percentage of write-ins vs. the percentage difference for Flores against Seidel and Tourtellotte-Palumbo.

North Thurston School District

I’ve spent a lot of time thinking about Lacey and non-Olympia districts, but generally in how they relate to county-wide races. So, my observations here are pretty much based on a surface reading of the maps and numbers, with no additional insights or experience.

Michelle Gipson beat a sitting school board member with a map that was centered on older and denser precincts, with rural districts generally going to her opponent:

This is largely the same map Gretchen Maliska had in her race:

Esperanza A. Badillo-Diiorio’s map is strikingly different:

While on first blush, this map seems like the opposite map of Gipson or Maliska. This would mean that Badillo-Diiorio took an opposing path to victory, but was able to win enough cross over voters to beat Gipson or Maliska’s coalition. But from what we know about Badillo-Diiorio’s race, this isn’t likely to be true. Her opponent had pulled out of the race and endorsed her, leaving no real organized campaign to pull votes in another direction.

So, looking at all three races from a different perspective, you see an obvious correlation between Gipson and Maliska’s precinct returns.

For Badillo-Diiorio, though, her returns cut straight across the charts. Her good and bad precincts have no connection to the good and bad precincts in the other races. Which is confusing to me, especially since there weren’t more write-ins or undervotes in this race than the other ones. This leads me to believe that voters made their choice for Badillo-Diiorio using other information or motivation than they did in the other two races.

From an interesting kind of map to more typical maps in Thurston County’s general election (Prop 1 and County Commission races)

The maps for this year’s general election cover the range of fairly typical results and one rare kind of result.

Prop 1

Proposition 1 won 56 to 44 percent, which is a pretty decisive win in county politics. But it also reconnected parts of the county that aren’t normally voting together. Proposition 1 was mostly branded as a “public safety” tax, but it would have also given some money towards election security.

This map, which shows mixed results across both very urban and very rural precincts, is rare but not unknown in Thurston County politics. To illustrate this point, both College (arguably the most liberal precinct in the county) and Zenkner Valley (the most conservative) were in the bottom three of precincts for Yes votes.

The first time I saw this map in Thurston County, it was 10 years ago, when Sue Gunn beat Jeff Davis for the port commission. In the case of Gunn, the urban/rural connection was likely two-fold: urban voters who were attached to her pro-environmental message and rural voters who were attached to her anti-tax messaging.

In terms of Prop 1, I imagine this connection would be for urban voters who were voting against funding for police and rural voters who were just voting (again) against any kind of tax.

Interesting are the 12 pivotal precincts in the election for Sheriff Sanders last year. Sander’s map looked a lot like a Democrat/Republican map with more blue precincts near downtown Olympia and getting more conservative as you head out. And even though Sanders performed worse compared to the topline Democratic candidate (Senator Murray), there were a dozen or so precincts that went for Sanders but not Murray. All 12 of these precincts, though some of them fairly rural, passed Prop 1.

County Commission

These maps are more traditional Dem/non-Dem maps in Thurston County.

First, Wayne Fournier, who won 50 to 49:

This is about as bare bones as an inside to out Democratic map can be in Thurston County and still win. It is interesting that Vivian Eason did much better in Southeast Lacey than other non-Democratic candidates have done. And, we might have to start considering the rural precincts out west of Tumwater heading into the Black Hills as Democratic precincts.

Emily Clouse, who won 60 to 39 percent.

Same kind of map, but just more blue. There were a handful of precincts south of Tumwater that went for her, which is interesting. It is also worth noting she lost a couple of precincts by Johnson Point that I thought she had a chance at.

Where this map is most useful is to contrast her map with Fournier’s.

Because Clouse won by a higher percentage, it makes sense she did better (in blue) over the vast majority of the county. She even did marginally better in Tenino, where Fournier is mayor.

But, where Fournier did better was in the rural precincts around Tenino. This is probably evidence of Fournier’s work about a year ago to rally against sex offender housing in Maytown.

The (mostly) lack of evidence of the impact of race in Badillo-Diiorio/Scott race in for North Thurston Schools

For me, the most interesting election in the county this year was between a candidate for the North Thurston School district and her opponent, who had endorsed here.

In a more perfect world, no one would have voted for Stephanie Scott. She did not campaign and had endorsed Esperanza Badillo-Diiorio weeks before the primary election. But because she endorsed Badillo-Diiorio after the deadline to withdraw, Scott’s name remained on the ballot. And, probably more importantly, her candidate statement remained in the Voters’ Pamphlet.

In one of the oddest possible returns in the primary, Scott even finished ahead of Badillo-Diiorio for a few days as ballots were being counted before the primary was certified, possibly knocking a candidate she supported.

No one’s fault really, that’s just the way elections work. And, Scott did spend a lot of time campaigning for her opponent, so it wasn’t that big a surprise that Badillo-Diiorio will be certified the winner of the general election in a week or so.

But what I was interested in was the phenomena of two candidates with the names Badillo-Diiorio and Scott, where Scott was the candidate not really running.

Matt Barreto wrote an influential paper in 2012 (then a professor at the University of Washington) describing his finding of racism in the Yakima County results in a race between well-funded (and now Supreme Court Justice) Steven Gonzales and un-funded, non campaigning Bruce Danielson. Basically, Barreto compared the results for Danielson by precinct against those of other conservative candidates and found that Danielson would outperform those conservative candidates.

You can read Barreto’s entire study here.

Barreto’s example of an election impacted by racism looks like this:

Using a similar technique, the Badillo-Diiorio/Scott race looks like this:

Instead of using Republican candidates, I used the composite returns of the two non-Democrats (who could be fairly described as conservatives) who ran for countywide offices.

While Danielson outperformed the Republican in 100 percent of precincts, Scott only won 57 precincts compared to 49. Hardly a barn burner.

It is worth noting, that in Barreto’s analysis, he found racism impacting voting in Yakima and Grant counties (on the eastside) but did not find it in Snohomish County. It is very likely that Thurston County is more similar to Snohomish than Yakima or Grant.

What is left unaddressed here or in Barreto’s work, is why anyone would vote for a candidate who is actively not campaigning. Or, more specifically, in Scott’s case, endorsing and campaigning for their opponent.

I’m sure the lack of media coverage in the race had some impact. Most of what voters heard in this race likely came from the Voters’ Pamphlet, which did not provide a lot of difference between the two candidates. That seems to be born out in the results. Compared to the two other North Thurston school races, Badillo-Diiorio/Scott had more undervotes (people not voting at all) and write-ins.

So, in the end, it is likely just voters not entirely sure what to do. The majority of Scott voters likely would have voted for her opponent had they learned she was no longer in the race.

Why Sixty-Five Road?

As roads go, Sixty-Five Road is a short one. On Olympia’s far Westside, it covers the gap between 20th Avenue NW and 14th Avenue NW. If you’ve ever been out to Hansen Elementary or Marshall Middle, that’s the road you’ve been on. It also serves as the western boarder to the Goldcrest Neighborhood and the eastern line of the Homeport Apartments.

For a boring name, it is also a very unique name. As a writer in the Olympian (who was exploring interesting place names) quipped in the 1980s: “Where, one wonders, are the other 64 roads?” Where, indeed.

That question leads us to the first clue in the origin of the name: it was likely a left-over from a defunct road classification system. For example, for 4th Avenue in Olympia, even if it wasn’t there, we’d assume the next most southern street is 5th. And, even though State Avenue is the one immediately north, we can safely assume at one point it was called 3rd. And, six blocks south of 4th is 10th. And, so on.

But, for Sixty-Five Road, there are no other north-to-south running roads with similar names.

But, let’s start at the beginning of the road’s history.

In Resolution 2833, the Thurston County Commission officially named in August 1961:

I find a couple of interesting things about this:

  1. It is just “Sixty-Five Road,” not “the Sixty-Five Road.” And, even though its presentation has changed over the year to include the number swapped (Road Sixty-Five) or turned into numerals and swapped (Road 65), it started out as written out.
  2. Currently, the southern end of Sixty-Five Road is 14th, but if you go east far enough, it becomes Walnut. In those days, Walnut was the name of the road all the way to that part of town.

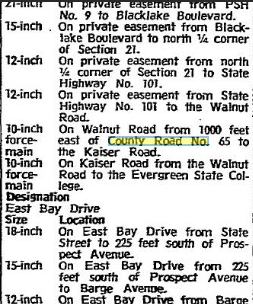
So, here is our first clue about an archaic road numbering system. This is a legal ad from 1970:

Since we know Walnut was the name of 14th when Sixty-Five road was named, we can assume “County Road No. 65” was also another name it was called. I’m assuming “County Road No. 65” was the official engineers’ name for the road, which was shortened in common use to “Sixty-Five Road” by the time it was officially named.

One of my favorite examples of this change in construction over time was the original name for Boulevard Road on Olympia’s Eastside, which was “Grand Boulevard.”

So, what we would need to find would be another reference to a “County Road No. xx” in the decades before the 1960s.

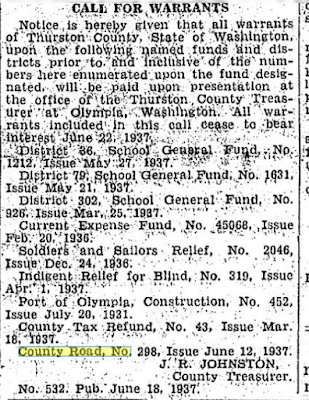
Here is what I found in 1937:

County Road No. 298 was definitely a thing that existed in Thurston County. I’m not sure exactly where, but there was at one point a numbering system for county roads with that construction.

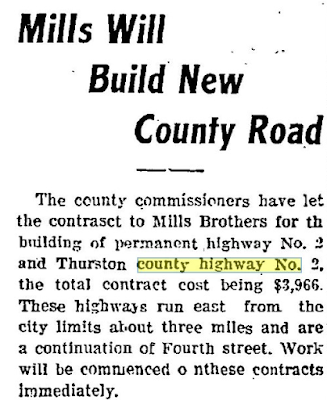
There is an additional reference I found from 1912 with the construction “county highway No. x”

So there you go, where are all the other 64 or 297 roads indeed?

© 2024 Olympia Time

Theme by Anders NorenUp ↑