Somewhere in Thurston County right now, someone’s staring at their Puget Sound Energy bill and doing the math. It’s not adding up. In January 2026, PSE raised residential electric rates somewhere between 9.3 and 13.1 percent, depending on how much power you use. For most households that’s more than eleven extra dollars a month. Not the end of the world on its own, but it’s been going up like this since 2012, and that adds up. Vonny Turner put it plainly on Nextdoor: his bill was running close to $600 a month, and he wanted to know if anyone else was thinking what he was thinking. Richard Ney was. So was Jeff Devlin, a mortgage guy who founded the Best of Olympia Facebook page. He’s not exactly a radical. Nextdoor isn’t exactly a hotbed of anti-corporate politics. On most days, the platform’s better known for people calling the cops on our houseless neighbors. But Devlin and his fellow posters have become the unlikely center of a real conversation about whether Thurston County should finally, after nearly a hundred years of trying, take its electricity away from a private company and give it to a public utility.
The conversation feels urgent and new. It isn’t. This is one of the longest-running political fights in Thurston County’s history, a conflict that’s outlasted its participants and its platforms, moving from union halls to legislative hearings to Facebook without changing its basic shape. Private utilities don’t give up territory. They create doubt, back the right candidates, outspend the opposition, and wait. It’s worked for nearly a hundred years.
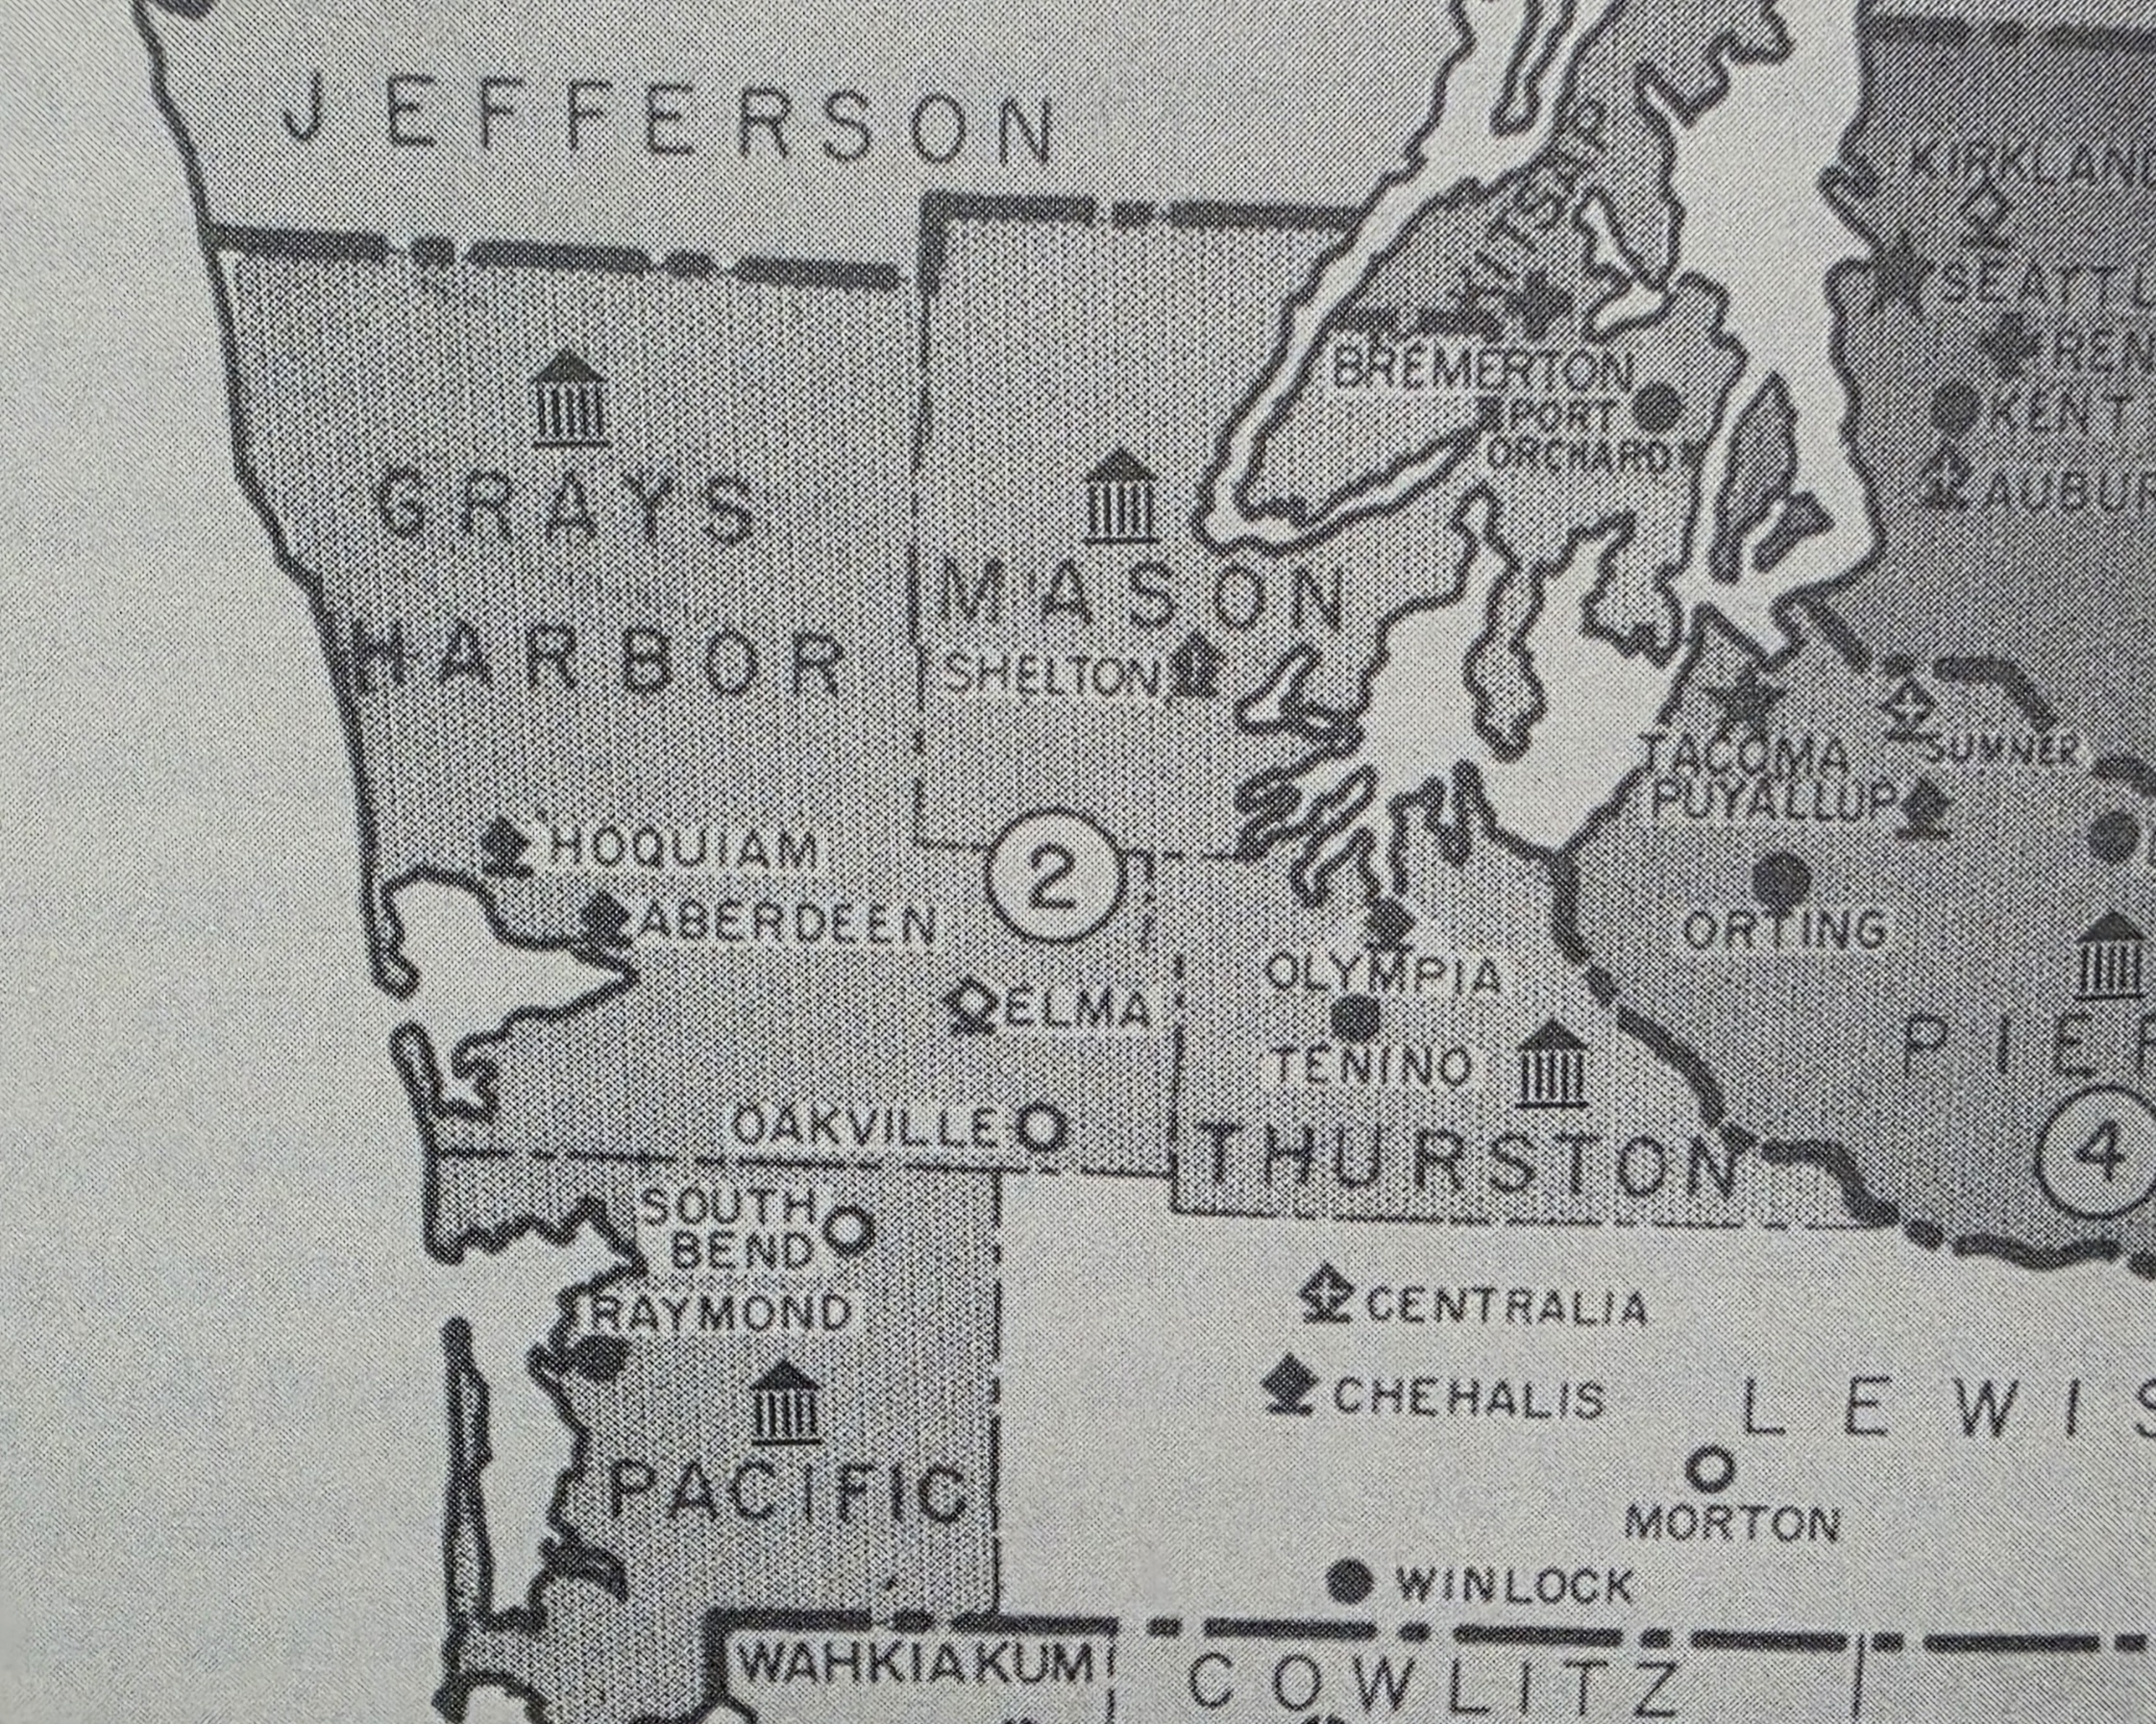
The legal foundation for public power in Washington goes back to 1930, when voters passed an Initiative that let communities form nonprofit, locally governed Public Utility Districts. It was a Depression-era idea, and it made sense at the time. Private utilities were squeezing people, and the idea that electricity, like roads and schools, should be owned by the public had real political momentum. Thurston County voted to establish PUD No. 1 in 1938. But the vote created a legal entity with nothing behind it. No wires. No substations. No staff. The PUD existed on paper while Puget Sound Power and Light, the company that would eventually become PSE, kept running the actual electricity.
In the early 1950s, Thurston PUD joined a coalition of six districts and tried to buy Puget Power outright. It was a bold move. Puget’s board actually agreed to the sale in October 1952, then reversed course in 1953 after public power advocates blocked a separate merger deal and spooked the company’s leadership. The whole thing fell apart. With no path to electricity, the PUD changed course. In the late 1950s it acquired the Tanglewilde water system near what is now Lacey and quietly became a water utility instead. The argument against letting the PUD handle electricity had always been that a bigger, established provider was simply better suited for the job. It’s a convenient argument if you’re already the established provider, and it would keep getting used for the next seventy years.
By 1960, a new set of PUD commissioners was ready to fight again. They moved toward legally condemning Puget Power’s properties, which would’ve forced a sale. Puget Power did what it knew how to do: it backed a candidate. Vic Francis won a commission seat, joining pro-public-power commissioners Harvey Thompson and John McGuire. Then McGuire died in the spring of 1961 and everything stalled. The commission deadlocked one to one. At the same time, the legislature got into a four-day brawl over HB-197, the “right-to-vote” bill, which would’ve required a public referendum before any utility property could be condemned. It was a procedural wall designed to make condemnation nearly impossible. Francis resigned in early 1962. The special election that followed was won with money. The pro-private-power candidates were better funded, ran on a “no acquisition without a public vote” platform, and won. That was effectively it for the next fifty years.
The new commissioners, having won, tried to unload what was left. They proposed selling the Tanglewilde water system to the City of Olympia and sent out an informal ballot. Only 147 came back. The slim majority who responded said yes to the sale. Harvey Thompson, the only old-guard commissioner still on the board, wasn’t buying it. He argued that 50 percent participation wasn’t a mandate for anything. The sale stalled, the whole thing dragged into September 1962, and ultimately nothing happened. The PUD kept the water system. The institution survived almost by default.
That near-miss opens up an interesting question. If Olympia had taken over the water utility serving those eastern suburbs before Lacey existed as its own city, before it had incorporated and built its own political identity, would Lacey have ever become Lacey?
Instead, the PUD grew. With its electrical ambitions gone, it turned all its attention to water and got very good at it. As of 2026, it’s operating 272 separate water systems serving roughly 10,416 connections across five or six counties, with systems in Pierce, Lewis, King, and Grays Harbor in addition to Thurston. It’s not really one utility so much as a patchwork. At one end you’ve got Tanglewilde-Thompson Place in Lacey, the original acquisition, now serving close to 2,000 residential and commercial units. At the other end you’ve got Group B systems, three to fourteen connections, tucked into cul-de-sacs, often the last remnant of some old private well arrangement that the PUD took on because no one else would.
There’s something almost poignant about it. The PUD was built to democratize electricity and ended up as a decentralized custodian of other people’s water, managing hundreds of small, scattered systems that bigger utilities never wanted. It’s genuinely good at this. But when people now point at the Thurston PUD and say that’s the organization that should take over our electricity, they’re pointing at an institution whose entire working knowledge is wells and pipes. Not wires.
In January 2012, I stopped thinking about public power as an abstract policy question and started thinking about it as something that had actually happened to me. A historic snowstorm hit the Pacific Northwest and knocked the power out. We had young kids at home, including an infant. The first couple of days we told ourselves it would come back soon. It didn’t. When it became clear the outage was going to last days and not hours, we packed up the kids and drove south to Oregon to find a warm room with family. The thing I remember most is a gas station in Lewis County, the first one we found that was still running. The noise. The lines. People’s faces. Everyone trying to get gas so they could get out. That’s my reference point when I try to picture what a Cascadia earthquake might actually feel like to live through.
I didn’t fully understand at the time why the outage had been so bad and so slow to fix. The answer is structural. Private utilities like PSE are accountable to shareholders first. Overhead transmission lines are cheaper to build and cheaper to maintain than buried lines, and that cost advantage is real until a major storm hits and takes down the whole region at once. When that happens, you find out there’s no full-time repair crew standing by, because keeping a full-time crew on standby costs money that cuts into margins. So you bring in contract crews, and so does every other utility in the region dealing with the same storm, and it takes time. Public utilities work differently. They put any surplus back into the grid and they answer to elected commissioners who live in the service area and hear about it directly when the power goes out. In the counties served by public utilities during the January 2012 storm, 95 percent of customers had their power back within 24 hours.
That number became an argument, if not the central argument for the public power campaign that launched in the fall of 2011 and hit the ground a few months after the snow storm. The storm had given advocates something specific and local to point to: we sat in the dark for days and our neighbors didn’t. The Thurston Public Power Initiative built its case around three things. Reliability, local control, and lower rates through access to federal hydropower from the Bonneville Power Administration, which private utilities can’t tap. The argument was solid. The campaign, by the organizers’ own later account, wasn’t well run.
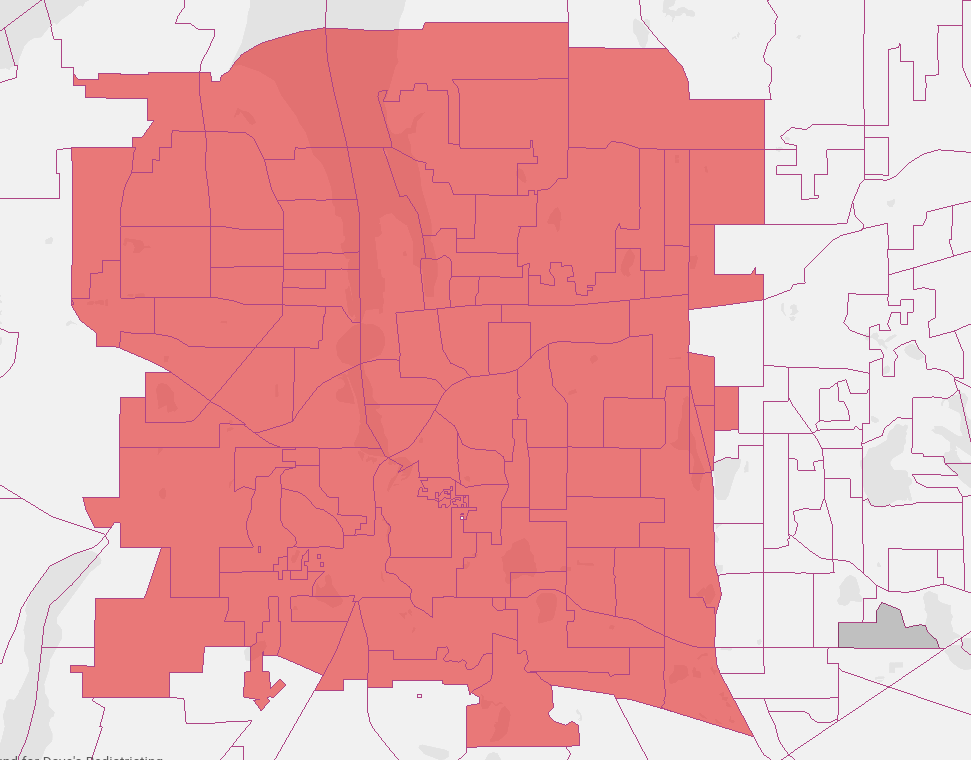
Proposition 1 went on the November 2012 ballot and lost badly. 59 percent voted no. 41 percent voted yes. The Alliance to Protect Thurston Power, the opposition PAC backed primarily by PSE, spent well into the six figures. The pro-initiative side raised around $37,000. PSE’s campaign hit the county with mailers, push-poll calls, and billboards, while separately running community goodwill advertising that presented the company as a generous local partner. The core scare message was about taxes. Independent analysts said the tax claim was misleading, that legal caps made the kind of increase PSE was implying essentially impossible without additional votes. It didn’t matter. The message landed. Voters were also stuck between two wildly different cost estimates: PSE put the acquisition cost close to $1 billion, while the PUD’s own analysis put it at $41 to $153 million depending on which parts of the service area you were talking about. That gap was enough to create real doubt. The Thurston County Chamber of Commerce came out against it. Former Secretary of State Ralph Munro said the PUD was taking on too much too fast.
The debate about ideas moved to costs and the better spending campaign was able to muddy the waters. And the pro-campaing could not or would not return to the cold houses and abandoned town in January.
The pattern across a hundred years is pretty consistent. In 1938, Thurston County votes to create a public utility and gets a legal shell. In 1952, a coalition tries to buy out the private utility and the deal collapses. In 1962, a private company backs its preferred candidates, wins the commission, and shuts down the acquisition effort for fifty years. In 2012, a corporation outspends a grassroots campaign sixteen to one and wins the county. In 2026, people are angry about their bills and the conversation is happening on Nextdoor instead of in union halls. The basic dynamic hasn’t changed. The opposition doesn’t have to win the argument. It just has to make the alternative scary enough that people stick with what they know.
Jeff Devlin’s change.org petition is just another possible start. So was the 2012 campaign, at the beginning. The question Thurston County has never managed to answer is what it would actually take to break this pattern. What does a movement big enough to overcome a corporate spending campaign look like? This time, is anyone willing to build it?