History, politics, people of Oly WA

Category: Olympia (Page 1 of 13)

Four questions from the last election in map form (Fall 2021 edition)

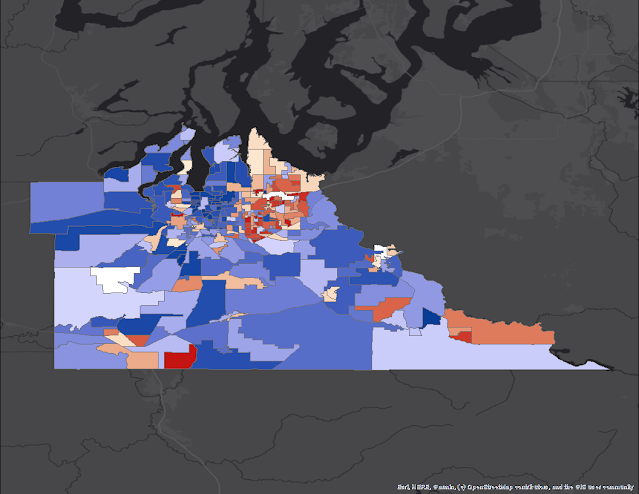
 1. Did Talauna Reed’s strategy of encouraging voting in high density apartment complexes work? 

2. Why did Reed get a post-primary bounce in SE Olympia?

And, it is more than the bottom line result that she did not win. When I look at the maps, she didn’t move the needle in the neighborhoods with large apartment buildings. I had seen this approach being promoted on social media, and I was incredibly interested to see if it would work (in a winning result) or move the needle (by improving her returns in neighborhoods with more large apartment buildings).

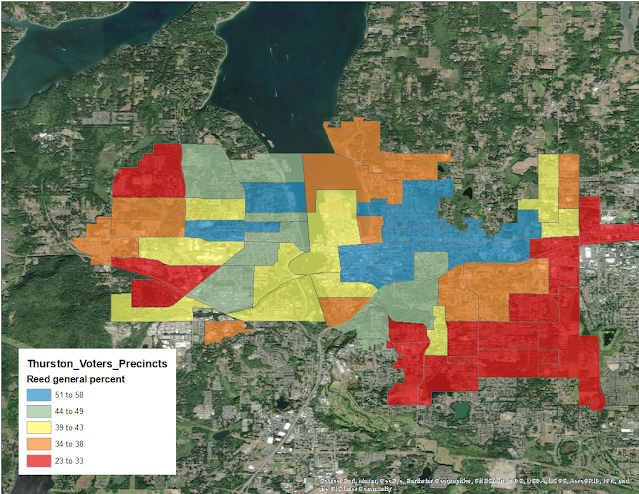
First off, here is the map for her overall vote percentage:

Her best precincts were basically on the Eastside north of the highway and on the near-in Westside. Only one of these precincts (the blue one furthest west) has a collection of larger apartment buildings. 

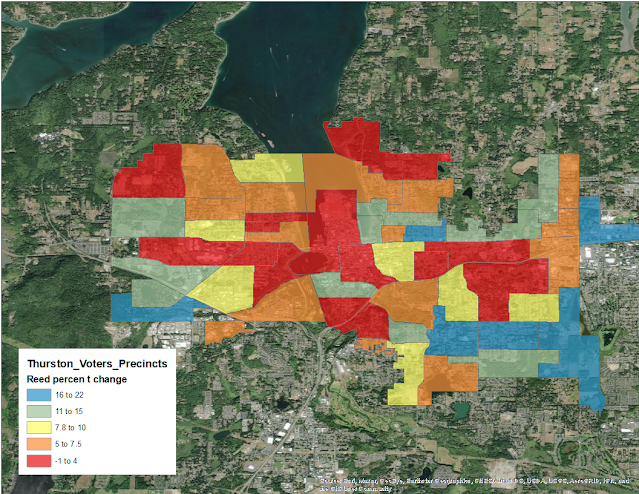
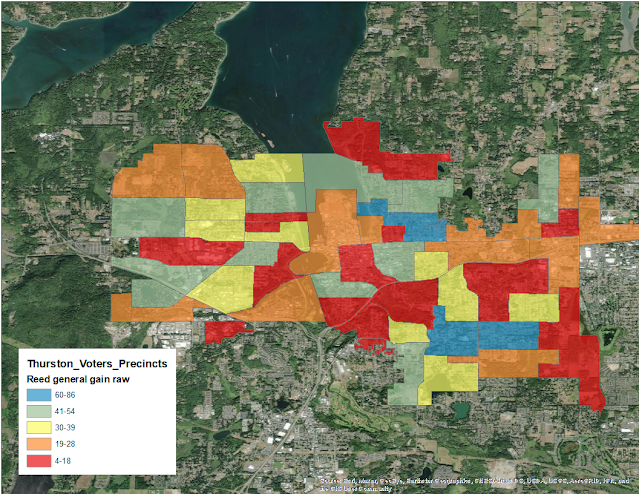
Since I heard about the approach to focus on larger apartment buildings after the primary, I think looking at the change in raw votes and percentage change would be important. This is especially true since the primary finished very close between Lisa Parshley, Reed and Wendy Carlson. This meant that Carlson’s large number of voters (for someone who didn’t advance) were up for grabs.

First, here is the percentage change:

And here is the raw number of votes change:

And here you might start seeing a pattern with higher turnout with apartment dwellers. On the far Eastside by the hospital and down South of Ken Lake there might be some movement. 

But what is also consistent in these two maps in the handful of SE Olympia precincts where overall Reed did not do well. They also had large movements toward her during the primary to general shift. These are places where Carlson had a lot of votes to give up after she didn’t make it through the primary. And despite not doing well, Reed picked up a fair amount of votes.

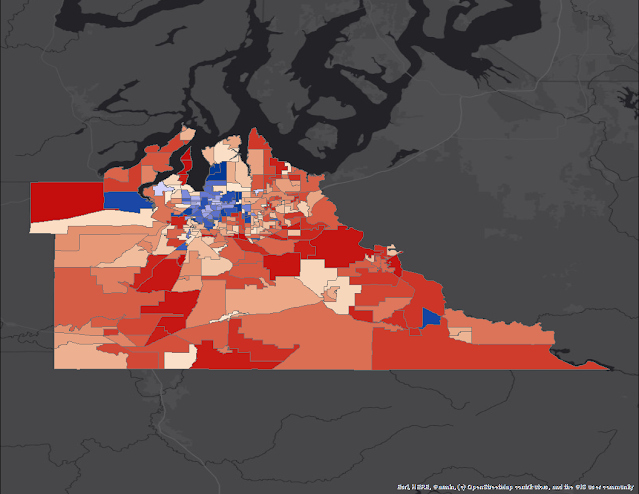
3. What is the meaning of the weirdest countywide map I have ever seen?

Eight years ago, I thought I’d seen the weirdest map ever when Sue Gunn won both extremely rural and conservative precincts and urban and liberal precincts. 

For a reference of how a Thurston County results map should look like, look at the Amy Evans/Joel Hanson for Port Commission map. Hanson is in blue, Evans in red.

Here you see the traditional urban to rural way these maps are organized. Hanson does better in the urban center of Olympia, while Evans does better in the rural areas and builds in towards Olympia. The battleground are the suburban belts around Olympia, including Lacey, Tumwater and a bit further out. From this map, you can see Evans won this by limiting Hanson’s precincts to largely inside Olympia.

But, would someone please explain to me this? This is the Bob Iyall (blue) and Jesse Simmons (red) race for Olympia Port Commission: 

As normal, Iyall did do pretty well in the middle of the map. And, if you told me that Iyall did really well in Olympia, but Simmons bossed all of Lacey, I would have said this map was a lot closer than what it was. Here, it seems like it is the rest of the county vs. Lacey. I have never seen a map in Thurston County where a candidate does really well in Lacey and isn’t able to translate that into better results elsewhere in the suburban belt or either in the urban core of Olympia or out in the rural areas.

4. Why did the right lane candidates have such varied success across the map?

I didn’t want to do election results maps for the other city of Olympia races, because they all seemed to follow the same pattern of conservative candidates doing well on the far Westside and SE Olympia  and the eventual winners doing well everywhere else. I did do Reed’s race because as the only one left in the progressive lane, she was unique. 

Well, what I did do was map the precincts won by any or all of the candidates in the right-hand lane. Candi Mercer didn’t win any precincts, so she’s not on this map.

The three remaining (Weigand, Kesler and Gauny) won several precincts in SE Olympia together. Weigand and Kesler then combined to win a couple more on the SE side and on the far Westside (both traditional conservative-for-Olympia territory). Kesler then won two on her own, both on the edges of town. Weigand in blue then picked up the rest of SE Olympia and the far Westside. He also won an inside precinct that includes the East Bay Harbor condominiums. 

Where Olympia has become less black in the past 10 years

 Last month I put up a couple of posts featuring maps that explore population growth in Olympia over the last decade.

The first map showed the uneven distribution of population growth across the city. The second map took a look at the change in the percentage of white people in the last ten years on the neighborhood level. 

I was thinking about the second map today and realized I may have done a disservice by using change in white population to properly illustrate change in race. It is true, Olympia overall has gotten more diverse in the last 10 years. The white population has barely budged from 38,000 (around 82 percent in 2010) to around 39,000 (75 percent in 2020). At the same time, the black population has increased from 931 (2 percent) to 1,340 (3 percent).

But it is important to note where that population increase has occurred. In fact, in some neighborhoods, the black population has decreased in the past 10 years, while the black population citywide has increased.

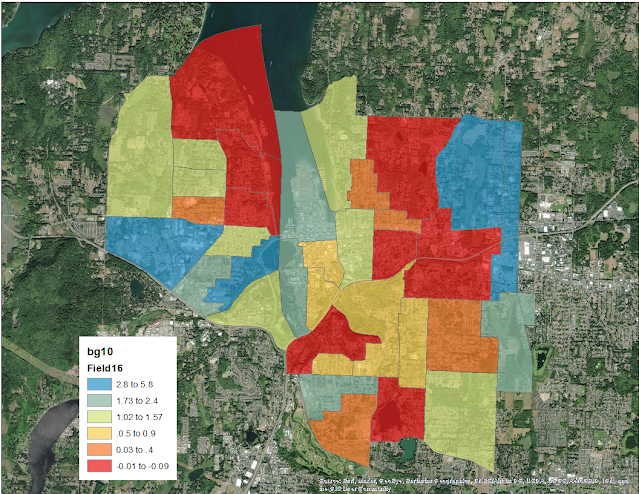
The most growth seems to be in neighborhoods I’ve discussed before. For example, I am not surprised at all that block group 105.1 (the blue section in the bottom left of the Westside) showed a large increase in percentage of black residents. The far Eastside near St. Peter’s also doesn’t surprise me.

All the neighborhoods marked in red saw a decrease in black population. These neighborhoods follow the same trend as the previous map on population growth. The neighborhoods that didn’t grow in the past 10 years also saw a decline in black population.

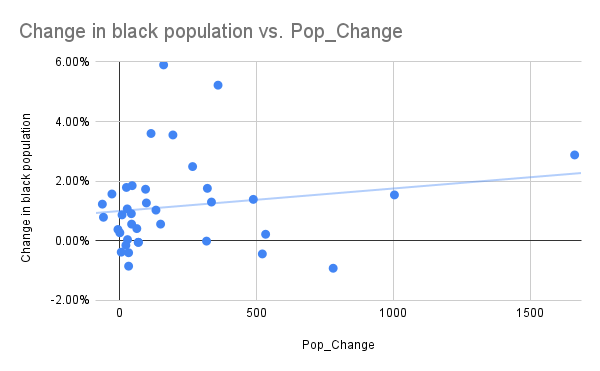
Again, there are outliers, but the relationship between the population increase in neighborhoods and the change in the number of black people living there is real. Here is population change charted against change in black population as a percentage:

2020 marked the close of the last decade of a long-term experiment we played in Olympia. We closed off growth in many Olympia neighborhoods beginning in the 1980s by systematically downzoning predominantly older, single-famly home neighborhoods. This was to prevent the spread of multi-family housing and the creation of “ghettos.” The Housing Options Plan passed right after the census data was collected largely reversed these downzones city-wide. 

You can find my data sources in the posts below. Here is my crosswalk file for this map.

More growth means more diversity for Olympia neighborhoods (more maps with census data!)

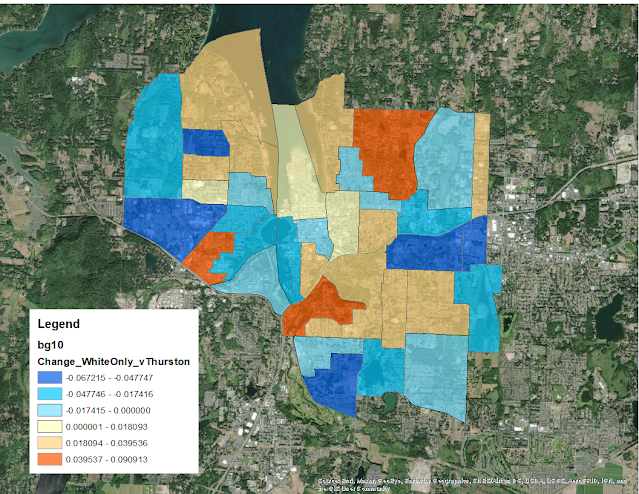
Every single block group in Olympia declined in the percentage of “white only” respondents. This isn’t saying a great deal. Olympia’s most diverse neighborhood is 62 percent white, it’s least diverse is 90 percent white.

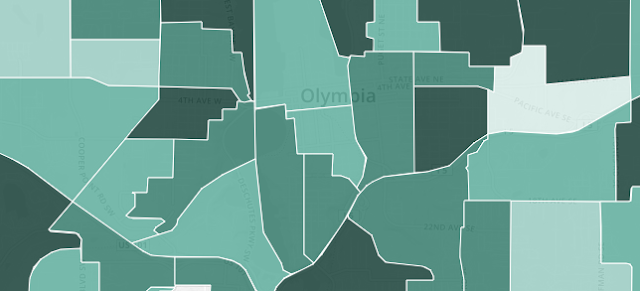
Taking Thurston County’s rate of diversification (going from over 80 percent white to just over 70 percent) as a measuring stick, I was able to rate Olympia neighborhoods. Neighborhoods in the map below in a shade of blue diversified more than Thurston County, in orange, less than.

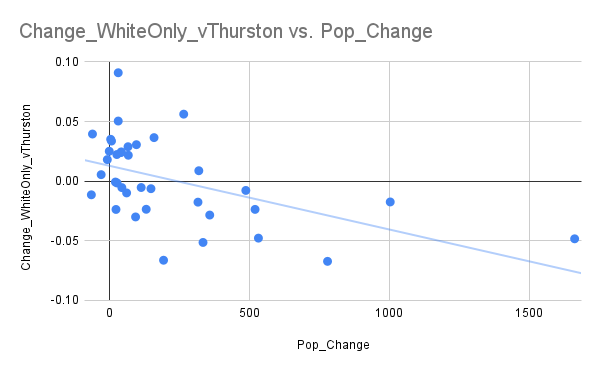
Taking the map from yesterday, there seems to be fairly strong correlation between neighborhoods that did not grow in the past 10 years and retained their lack of diversity (when compared to the rest of the county).  

In fact, when you take the raw data (population change vs. racial makeup change), you see a trend towards neighborhoods that grew less staying whiter.

There are definitely some neighborhoods that run counter to the trend. But, citywide, the neighborhoods that grew were the ones that became more diverse.

I included technical notes in my previous post on population growth by neighborhood if you want more information about how I got here. I did though update my crosswalk document to include the race data that I used in this post.

Where Olympia didn’t grow (and even lost population) in the last 10 years (this time with census data!)

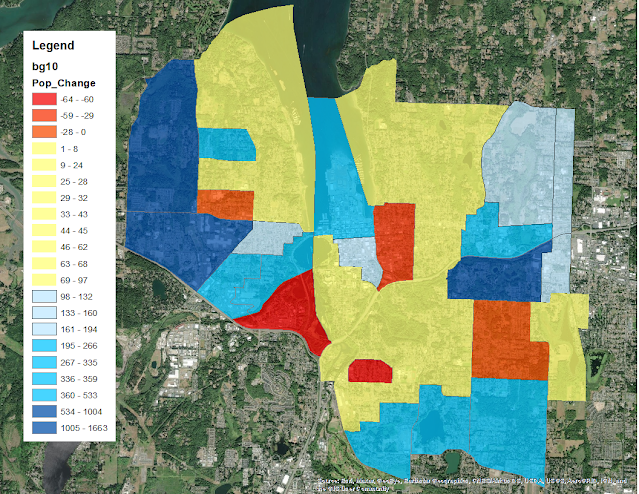
Olympia’s neighborhoods saw varying patterns of population growth and contraction over the past 10 years.
Olympia grew by almost 10,000 residents and Thurston County as a whole grew by over 40,000 in the 2010s. Obviously, population growth is not evenly spread across the county. But it is amazing to see that while the population of our community grows, there are neighborhoods so walled off by exclusive zoning, that they were able to fend off this growth.
I’m convinced that the slow and declining growth in population in these neighborhoods is the on-the-ground impact of exclusive single-family zoning. After years of work, Olympia finally passed zoning rules at the end of the decade that ended this kind of zoning.
You can see below that the story isn’t nearly as simple as “single family neighborhoods shank/didn’t grow and multifamily neighborhoods grew.” The 2010s did seem to serve as a natural experiment of what the long-term impacts this zoning had on neighborhoods.
Olympia started clamping down on neighborhood multifamily housing (like duplexes and cottage apartments) in the late 1970s. The 2010s were the fourth decade of this kind of enforced low density, and the recently released census data gives us a way to examine its impacts.
Here is the map I ended up with:
Here is what I take away from this map:
1. The vast majority of Olympia grew very little. I colored block groups that didn’t increase more than 100 people in yellow. And, these block groups make up most of this map. While these areas did grow, it is worth noting that they did not grow very much.
 
2. The neighborhoods that shrank were a mix of housing types. Especially, the two block groups on the Westside include a significant number of apartments. It is worth noting that the apartments and other multifamily zoning there are older structures.
 
3. Except for downtown, all of Olympia’s growth happened on the edges. For a few block groups, especially on the far east edge of Olympia and on the Westside along 101, this is where a significant number of new apartment buildings are being built. While a lot of attention has been paid to multifamily housing downtown (which has brought in new residents), the real driver of Olympia’s new population are less flashy apartments along the edges.
I wrote more about the apartments being built on the Westside last year, illustrating how multifamily housing on the edges of Olympia are driving racial segregation.
A few notes on how I did this work:
  • I did a similar examination a couple of years ago using American Community Survey data. While I found similar shrinking neighborhoods then too, the ACS data is an extrapolation of survey data, and is less precise than the census headcount.
  • Block groups are just about the narrowest geography you can assess changes in population change across Olympia. I had to cross-walk a few block groups that had broken in smaller pieces. I posted my notes on that in this spreadsheet.
  • The data and shape files are the OFM datasets of the recent census release.
  • Because I did the cross-walk, the geographies I mapped were the 2010 block groups, since I combined the 2020 block groups.
  • The block groups I picked do not line up with the borders of the city exactly. In places where I had to choose, I chose to go over the border of the city.

Tract 105 in Olympia. Or a story of how the nodes argument of density is racist

Last week I wrote about how on the macro-level, Olympia’s neighborhoods are racially segregated along density lines. The more single-family homes in a neighborhood, the higher percentage of white people that live there. And now I’ve found an example of how adding high-density housing in one neighborhood, and preserving single-family housing in the neighborhood next door, has a predictable impact on racial make-up.

Up until the 2010 Census, Tract 105 on Olympia’s westside was one tract. But, since then it has been split into two tracts, 105.10 on the west and 105.20 on the east.

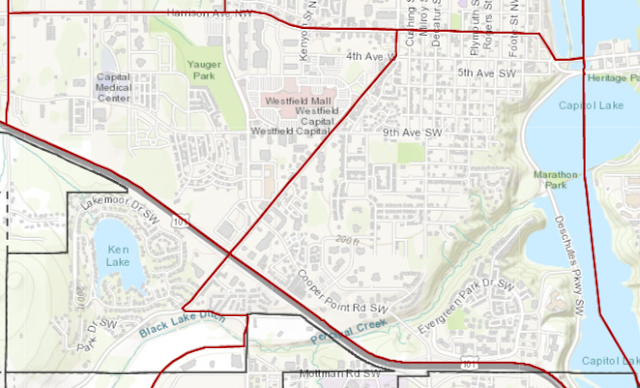
The two new tracts are split by Black Lake Boulevard. They range from the older residential neighborhood on a bluff over Capitol Lake to newer neighborhoods around Capital Medical Center and Yauger Park.

And, their journeys since their 2010 schism show how our current housing policy, especially the “nodes” approach, results in more white, single-family neighborhoods. While our intention hasn’t been to create zoning that segregates on racial lines, that is what we’ve done.
The nodes approach to growth and density argues that we should build extremely high density near Capital Mall, the far Eastside and downtown. Then we won’t have to allow for more reasonable increased density in exclusive single-family neighborhoods.
105.20 has been fairly static for the last 10 years in terms of available housing. It includes many older, largely single-family blocks. Before the 1980s, these blocks would have slowly densified as older single-family houses were replaced by duplexes, quadplexes, and small apartment buildings. This was the trend that was stopped forty years ago when we downzoned many near-downtown residential neighborhoods. 
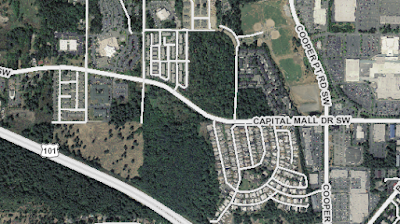
105.10 started the decade as a mostly commercial tract with a mobile home park and a few apartment buildings. Also, several undeveloped green zones. Since then, it has added a couple of new apartment complexes along either side of Capital Mall Boulevard where trees once stood.
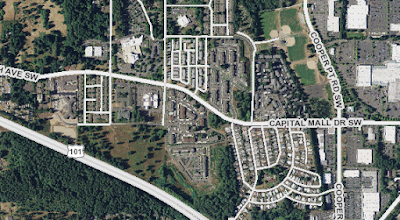
A major portion of 105.1 in 2010:
2018:
Both tracts also began the decade in significantly different spots, racially speaking. 105.20 was comprised of just a hair less than 80 percent white people, a lower percentage than a city on the whole. 105.1 started as an extremely white neighborhood, clocking in at almost 94 percent. 

105.1 total 105.1 % white 105.1 white 105.1 nonwhite 105.2 total 105.2 % white 105.2 white 105.2 nonwhite
2010 1447 93.99% 1360 87 5853 79.57% 4657 1196
2017 1887 81.40% 1536 351 6547 85.75% 5614 933
Change 440 -12.59% 176 264 694 6.18% 957 -263

Since then, they’ve gone in completely different directions. 105.1 became strikingly more diverse in seven years, with its white population dropping to 81 percent. 105.2 went in the opposite direction, with its white population growing to almost 86 percent.
It looks even worse for 105.2 when you look at the raw numbers. The total number of non-white people living in 105.2 dropped by over 200 people between 2010 and 2017. At the same time, 150.1 went up by almost the same amount. 
This has all happened as Olympia as a whole has slowly become more diverse, going from 85 percent white in 2000 to 83.6 percent white in 2010 to 82.5 percent white in 2017.
One neighborhood built high-density housing (in a node) and became less white. The other followed the node approach by protect existing single-family homes and became more white.
It is also worth noting, that while 105.2 got whiter in the last decade, it also includes a significantly sized apartment complexes. These are mostly concentrated along Black Lake Boulevard and Evergreen Park Drive. But, if you look back at the block-by-block data available from the 2010 Census, you see a stark racial breakdown even within 105.2.
The blocks zoned single-family are much more likely to be whiter.
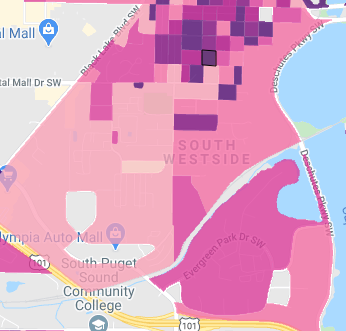
From JusticeMap, darker blocks are more white:
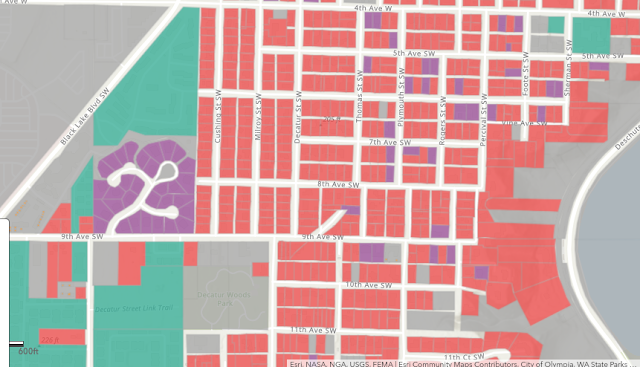
From Thurston Geodata, the red are single-family homes:
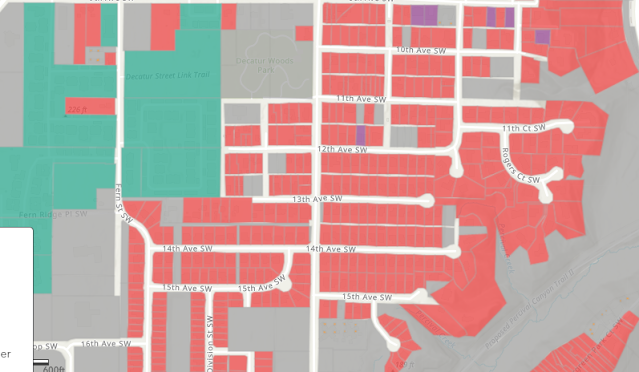
And further south:
The further you get in the single-family home portions of 105.2, but especially north of 9th Avenue, the more likely blocks are going to be white.
So, if you got this far, it’s clear that as we build denser housing outside of single-family neighborhoods (and in an environmental lense, in what used to be a forest), we are also keeping single-family neighborhoods white.

There is no law in Olympia that some neighborhoods are reserved for white people. But, by focussing building higher density housing outside of these exclusive single-family zones, this is what we’re doing. This is the current “nodes” strategy, or has some have called it “density done right.”
And, this is the intention vs. impact this when we talk about racism (here and here). 
I think it’s helpful to quote Rachel Cargle here in her frame on racism:

Recognize that even when your good intentions are truly good, that’s totally meaningless. Try this on for size: when you accidentally step on somebody else’s foot, you do not make your good intentions the focus of the episode. Instead, you check to make sure the other person is OK, you apologize, and you watch where you’re going. You don’t get annoyed with the person you stepped on because you caused her pain or declare that she is too sensitive or defend yourself by explaining that you meant to step to the left of her foot… But I’m a nice person does not cancel out the fact that you’ve silenced, marginalized or used your privilege to further disenfranchise black and brown people, whether you intended to do it or not.

We don’t build neighborhoods with racially exclusive covenants (but we did once). There is nothing in our Comprehensive Plan that says it’s our intention to build super white neighborhoods. But by not allowing even modest high-density housing throughout our city, we are doing a lot of damage.
Building more affordable housing types (literally anything other than single-family homes) would allow a more diverse population to grow. And, in conclusion, I’m just going to leave this here: being able to live in a walkable, liveable (non-node) neighborhood is good for everyone.

How did our housing practices shape Olympia’s racial makeup?

Amanda Smith, the former mayor of Olympia, sat in a suddenly silent city council meeting in the spring of 1968. She had been mayor in the 1950s and had come back to city hall to speak out in favor of an ordinance to prevent housing discrimination.
Duke Stockton had just stopped speaking against the ordinance and had pieced together a speech that shocked the crowd to silence.
“A man should have the right to do what he wants with his own property.”
“We don’t want them living in Olympia, but if they do live here, let them stay in their own communities and leave us alone.”
“It leads to intermarriage…”
Mayor Smith was the first to break the silence: “I wonder if everyone’s heart was beating as hard as mine was as I sat and listened to that. I have never heard a more ignorant talk in my life!”

Given what we know about the world back then, I can hardly believe that to be literally true. But it is possible that the debate over open housing only brought such attitudes to the surface.
Olympia along with Thurston County, Lacey, and Tumwater, would end up passing Open Housing ordinances in 1968. The effort here was part of a longer effort nationally and statewide to break apart racist housing practices.
Back up a little first: It is fairly well known that as a local rule that currently Lacey is more racially diverse than Olympia. The vast majority of Olympia’s neighborhoods are still over 85 percent white, with only a few outlying neighborhoods below 80 percent at all. The most racially diverse neighborhood in Olympia is about 65 percent white and is the section between the Martin Pacific split and Interstate 5 where it crosses Pacific.
Lacey, on the other hand, has more racial diversity in general. Specifically, Lacey has more neighborhoods with higher concentrations of non-white residents. 
When housing activists were lobbying our local governments for open housing rules, Lacey held back at first because the leaders of the new city (only founded in 1966) were under the impression that Lacey already was open to all races. They passed the open housing rules anyway.

The housing practices that Amanda Smith and other Olympians were trying to prevent by adopting Open Housing rules in the 1960s were in reaction to decades of racist practices. It seems that at least on the surface, we’re still seeing the impact of these practices decades later.
Here is a deeper dive into these practices and how they worked:

1. Olympia real estate agents as late as the 1960s actively steered African American home-buyers away from certain neighborhoods.

From the Olympian in 1968:

(African American residents) put the blame for the trend toward a (racially segregated) ghetto squarely onto the practices of some real estate businessmen… 

What is happening, they say, is that real estate salesmen are trying to steer Negroes into certain areas while at the same time urging whites not to buy there “because Negroes are moving in.” A check with some whites who are hunting houses confirms this. 

According to at least one Lacey city councilmember in the 1990s, Lacey was one of the places where real estate agents would steer minority customers.

2. There were certain neighborhoods in Olympia that as late as the 1940s were officially off-limits to anyone who was not white.  


This is by no means a comprehensive list, but while it didn’t seem to be common practice, there were a few neighborhoods in Thurston County that has racial covenants. Two of these were in Olympia, and a third I found was Beachcrest, north of Lacey. 

Stratford Place, one such neighborhood just north of Olympia High School, had these racial covenants baked in.

Another neighborhood just up from the end of West Bay Drive, also advertized homes based on racially exclusive covenants.
When you look at how widespread this practice was in King County, I was a little surprised I could easily find more examples in Thurston. There is a lot of history behind racial covenants, and this paper is a great long walk through their use and eventual rejection.
Moving on from the 1960s, we continued to have housing debates in Olympia. But as they continued, they had more to do with density and liveability than they had to do with (one the surface) race.
Less than 10 years after Olympia, Tumwater and Thurston County passed Open Housing ordinances, Olympia began a long debate about multi-family zoning throughout the city. While this debate mostly centered upon income (and sometimes crime), it certainly had the same structure that the debate around anti-discrimination fight had in the late 1960s.
The 1970s saw the largest influx of new residents in Thurston County’s history. It changed the nature of our communities and it drove a historic increase in higher density housing types in Olympia. The historic nature is true because after this influx we made most of these housing types (duplexes, quadplexes) illegal through most of the city. 
One term that got thrown around during the housing debate in the 70s and 80s was also “ghetto.” While the term in the 1960s obviously meant a neighborhood with a large non-white population, what did it mean in the 1980s? Were our anti-density rules stemming from that era racially motivated? Obviously, on a certain level, they were motivated out of a fear of crime and nearby poverty. But how far did we grow in just over 10 years?

Olympia housing post in two parts: Answering a question on Ron Rants and asking a question on Samuel Stein

Both of these came up at the same time, so I’m doing them in one post.

1. Answering Steve Salmi’s question here first:

…Dan Leahy was right to “follow the money” regarding tax breaks for developers – including Ron Rants. Olympia would do well to display greater transparency in its decision making if it wishes to build the credibility of Missing Middle initiatives. 

For the sake of historical honesty, it would also be helpful to know if Ron Rants is now being subsidized to undo the very problems he helped to create – both as an elected official and a development industry leader.

On the first go around on this post, I actually noticed a few places where Ron Rants, in fact, sounded like a 2010s era urbanist.

First from May 1980:

Fellow commissioner Ron Rants said the existing policy didn’t mesh with his personal view. The city should be encouraging mixed housing, he remarked. Mix housing includes having duplexes in single-family neighborhoods.

Then in September 1980:

Rants said the city, in fact, should encourage denser living patterns within city limits, to put an end to what he called rapid leap-frog growth to the county.

I will say that Steve’s point that the city commission, which was on its way out in the early 80s, was certainly the body that laid the groundwork for a series of downzoning in the 80s and 90s, they didn’t seem to be enthusiastic about putting on the density brakes. In fact, to me, it seems like the same populist dynamics that put in the city council form of government where the same dynamics that were also arguing for exclusive single-family zoning throughout the city.

2. In the past few months, the opponents of denser and less expensive housing in Olympia have started using Sam Stein’s “Capital City” like a cudgel. Without really explaining how Stein’s arguments about how the modern real estate industry works in regards to single-family zoning, they simply state that more options for buildings (for-profit, non-profit or government) would just allow for more building and builders are bad.

While this behavior does fall into the broader “why NIMBYs just hate developers” thing, it doesn’t really center Stein’s arguments in Olympia’s history of downzoning. I poked around Stein’s book for discussion on downzoning on a broader scale, like what happened in Olympia or Los Angeles in the last 50 years. 

A historic district, a contextual rezoning––which means changing the zoning rules to match what’s there right now––or a downzoning, which means in the future people will only be able to build smaller than what’s here right now. So it wasn’t even, I said neighborhood before, but it’s really block by block, block by block by race, so white blocks––predominantly white blocks––got protected, predominantly African American, Latino, and Asian blocks were subject to big, new development. And so, the result of that ends up looking like integration. If you look at those prior, mostly Black, Latino, and Asian blocks, and you see there was this luxury development that was built and suddenly all these white people moved in, now something else is happening. But at the same time, they cut off the ability to build out low-income and mixed-race development on those white blocks. And so, they were channeling integration in one way and cutting it off in the other. It’s like a one-way street that’s going––there’s a one way street and you’re moving in the wrong direction. If we want to do integration, we need to unsegregate those white spaces. The problem is not the concentration of people of color in neighborhoods that they built up over a long period of segregation and disinvestment. So that in many cities the integration that’s happening is the exact wrong way to do it.

In context to Olympia and the Northwest, this brings up a few things for me.

One, we’ve seen how the debate over changing single-family neighborhoods into “ghettos” has affected the course of Olympia housing policy. Calling people racists in historic terms is not fun, but I’m just going to leave that there.

Two, people who trot out Stein are also unironically talking about “nodes” of high-density growth in Olympia. There are places where added density that could take place in single-family neighborhoods should more appropriately go. And, unsurprisingly, when you poke around a block group map of white distribution around Olympia, places with a lot of apartments (existing “nodes”) also have the fewest white people.

So, to my question: how is Stein’s discussion of protecting white neighborhoods not like what happened and is happening in Olympia?

Where Olympia has lost population

When you think about population change in a growing region, you think of it as a constant. And, even though Olympia has been lagging behind Lacey in growth rate for the past few decades, Olympia is still on a gradual population climb.

But, that population growth has not been consistently spread across the city. In fact, there are numerous neighborhoods that have actually lost a significant amount population in recent years.

To explore this phenomenon, I built a map in a tool called Policy Map. The variable I used was the rate of change in the five years between 2013 and 2017, according to the American Community Survey. These are interesting years because it was a time when the incoming population of our area outpaced new housing. So, at least in theory, our available housing became more crowded, not less.

A small caveat about this data. It is based on survey results collected by the Census Bureau. Being survey results it is less accurate than actual decadal census data. That said, all of these neighborhoods have seen measured losses of over 13 percent, which would probably outstrip any margin of error.

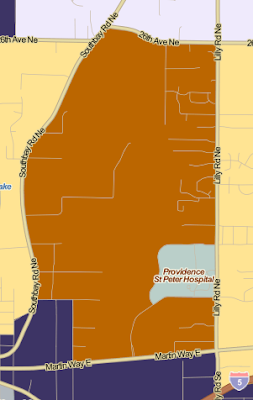
The first neighborhood in Olympia that lost a significant amount of population (again, more than 13.46 percent) was this one up in far northeast Olympia.

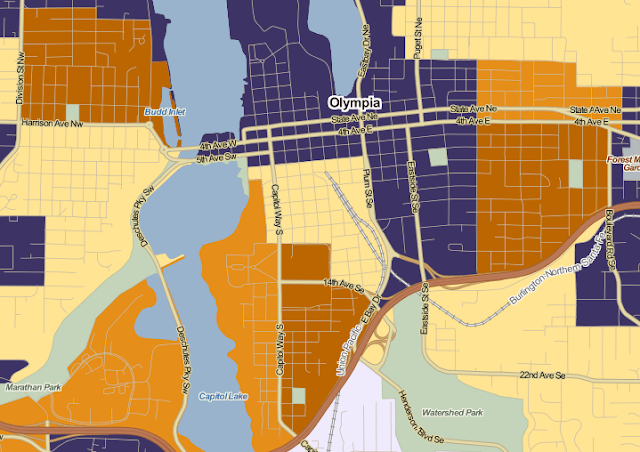
This Lilly to Southbay Road neighborhood is the outlier in the type of neighborhood that has lost population though. The much more typical neighborhood (in dark brown below) is an older, inner residential neighborhood.

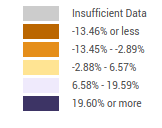
Here’s the map key:
I’ve written about these neighborhoods before and in my mind, these are the neighborhoods that beginning in the late 1970s started seeing the impacts of growth cascading out of downtown. They experienced an influx of what we now call “missing middle” housing, multiplexes and small apartment buildings. But, instead of welcoming the growth and naturally more dense neighborhoods, these neighborhoods downzoned and pushed additional growth towards the edges of town. This new growth, in turn, paved over farms and forests.
But, why now are these neighborhoods that up until a few months ago were protected habitat for single-family homes losing population? Obviously, the neighborhoods weren’t becoming denser. I’m having a hard time finding data on the change in household size in the same year, but it stands to reason that stable households would have children age out eventually. If the parents stayed put, then theoretically, the population would decline. 

Your semi-regular update on what schools have low vaccination rates around Olympia

Usually, about when there is something in the news about an outbreak around here, I’ll go to the state Department of Health and find out what the vaccination rates are at our local schools (and here). This time around, there is a measles outbreak just about an hour south of us, so I thought it would be nice to narrow in specifically on exemptions (personal, religious or health) for the measles, mumps, rubella vaccination.

According to the most recent data, there are a handful of schools in the Olympia area with fairly high exemption rates for the MMR vaccine.

School Percent exempt for measles, mumps, rubella Percent with any personal and religious exemptions (not just MMR) Percent with medical exemption (not just MMR)
OLY REGIONAL LEARNING ACADEMY 16.2% 22.1% 6.3%
ORLA MONTESSORI 15.5% 23.5% 8.5%
OLYMPIA COMMUNITY SCHOOL 12.9% 29.0% 12.9%
LINCOLN ELEMENTARY 12.7% 24.0% 4.6%
GRAVITY 12.5% 12.5% 0.0%
AVANTI HIGH SCHOOL 12.0% 19.0% 1.4%
Paramount Christian Academy 9.1% 9.1% 0.0%
TUMWATER WEST 9.1% 9.1% 0.0%
NOVA SCHOOL 8.6% 10.5% 1.0%
PIONEER ELEMENTARY 5.9% 10.6% 2.7%
BLACK LAKE ELEMENTARY 5.7% 7.7% 1.7%
REEVES MIDDLE SCHOOL 5.1% 13.6% 2.0%
MICHAEL T SIMMONS ELEMENTARY 5.0% 6.7% 1.4%
THURGOOD MARSHALL MIDDLE SCHOO 4.9% 8.2% 1.8%
BOSTON HARBOR ELEMENTARY 4.7% 8.3% 2.4%
ROOSEVELT ELEMENTARY 4.6% 7.2% 1.7%
GARFIELD ELEMENTARY 4.6% 9.9% 2.2%
EVERGREEN CHRISTIAN SCHOOL 4.4% 7.8% 0.0%
TUMWATER HIGH SCHOOL 4.1% 6.5% 0.8%
NEW MARKET HIGH SCHOOL 4.0% 4.0% 0.0%
EAST OLYMPIA ELEMENTARY 3.9% 5.5% 0.4%
MARGARET MCKENNY ELEMENTARY 3.9% 4.2% 0.0%
OLYMPIA HIGH SCHOOL 3.9% 9.6% 0.3%
JEFFERSON MIDDLE SCHOOL 3.9% 6.6% 0.9%
CENTENNIAL ELEMENTARY 3.7% 5.4% 1.1%
BLACK HILLS HIGH SCHOOL 3.7% 6.4% 1.5%
CAPITAL HIGH SCHOOL 3.7% 7.0% 0.6%
PETER G SCHMIDT ELEM 3.7% 4.5% 1.0%
GEORGE WASHINGTON BUSH MS 3.5% 6.7% 0.6%
LITTLEROCK ELEMENTARY 3.1% 4.5% 1.4%
SOUTH BAY ELEMENTARY 3.1% 4.1% 1.0%
TUMWATER MIDDLE SCHOOL 3.1% 5.0% 1.0%
TUMWATER HILL ELEMENTARY 3.1% 4.2% 0.5%
WASHINGTON MIDDLE SCHOOL 2.8% 6.3% 1.0%
LACEY ELEMENTARY 2.8% 3.6% 0.8%
OLYMPIA CHRISTIAN SCHOOL 2.6% 10.5% 0.0%
LYDIA HAWK ELEMENTARY 2.5% 3.1% 0.2%
MEADOWS ELEMENTARY 2.4% 2.8% 1.0%
SOUTH SOUND HIGH SCHOOL 2.4% 3.0% 0.0%
SECONDARY OPTIONS 2.4% 3.9% 0.8%
OLYMPIC VIEW ELEMENTARY 2.3% 2.5% 0.9%
NORTH THURSTON HS 2.3% 5.8% 1.4%
NORTHWEST CHRISTIAN HIGH SCHOOL 2.3% 2.3% 0.8%
CORNERSTONE CHRISTIAN SCHOOL 2.2% 2.2% 0.0%
JULIA BUTLER HANSEN ELEMENTARY 2.2% 2.2% 1.1%
MADISON ELEMENTARY 2.1% 5.4% 0.0%
GOSPEL OUTREACH 2.0% 2.0% 0.0%
HORIZONS ELEMENTARY SCHOOL 1.9% 2.6% 0.9%
L P BROWN ELEMENTARY 1.8% 2.4% 0.3%
COMMUNITY CHRISTIAN ACADEMY 1.8% 3.0% 0.0%
ST. MICHAEL SCHOOL 1.7% 3.5% 0.9%
KOMACHIN MIDDLE SCHOOL 1.7% 3.5% 0.9%
TIMBERLINE HIGH SCHOOL 1.7% 3.4% 0.4%
CHAMBERS PRAIRIE ELEMENTARY 1.7% 3.3% 0.7%
NISQUALLY MIDDLE SCHOOL 1.5% 2.7% 0.7%
WOODLAND ELEMENTARY 1.4% 2.2% 0.3%
RIVER RIDGE HIGH SCHOOL 1.4% 3.2% 0.5%
SALISH MIDDLE SCHOOL 1.3% 2.3% 0.7%
ASPIRE MIDDLE SCHOOL 1.2% 4.9% 0.0%
EVERGREEN FOREST ELEMENTARY 1.2% 2.8% 1.2%
HOLY FAMILY SCHOOL 1.2% 1.2% 1.2%
POPE JOHN PAUL II HIGH SCHOOL 1.1% 1.1% 0.0%
MCLANE ELEMENTARY 1.0% 2.3% 1.3%
CHINOOK MIDDLE SCHOOL 0.9% 4.0% 0.9%
MOUNTAIN VIEW ELEMENTARY 0.8% 2.0% 0.5%
PLEASANT GLADE ELEMENTARY 0.7% 1.7% 0.7%
SEVEN OAKS ELEMENTARY 0.7% 2.0% 0.2%
NEW MARKET SKILLS CENTER 0.3% 0.3% 0.0%
TOUCHSTONE SCHOOL 0.0% 0.0% 0.0%
CAPITAL MONTESSORI SCHOOL 0.0% 0.0% 0.0%

Here is the most recent data from the state and the spreadsheet I used.
What leaves me scratching my head about this data is that when you parse out the medical and personal exemptions, they seem to follow the same general pattern. Schools with high personal/religious exemptions also have high medical exemption rates. 
When I first started looking at this stuff, I assumed medical exemptions would be evenly dispersed across the area. It follows that since all of the schools that have high exemption rates are schools you either generally lottery into or opt into, that the personal/religious exemptions would gather there.  In the same way that opting into certain schools is an expression of a family’s choice, so is opting out of vaccination. But the medical reasons for not being vaccinated, I don’t think, would be more general and would not necessarily be tied to a family’s school choices.

If you’re new to this issue or just need some background, here is some information you might find useful:

Here is an explanation on how those exemptions work.

You’ve heard about herd immunity, or how the vaccination rate in a group of people that protects people who can’t receive a vaccine. This is why a 16 percent exemption rate at ORLA or a 12 percent exemption rate at Lincoln are sort of scary.

According to the CDC, an immunization rate of 94 percent is necessary to prevent pertussis from persisting in a community. That is above the 88 percent that the exemption rate at Lincoln would indicate is that school’s immunization rate.


Renters are nice people and other thoughts on the demagoguery of the Missing Middle

Missing Middle from AIA Austin

Right now the Olympia planning commission is considering a list of recommendations about the so-called Missing Middle. These recommendations would hopefully increase density in Olympia’s least dense neighborhoods by allowing duplexes, townhomes, courtyard apartments and ADUs in the mostly the upper elevation swaths of single-family homes neighborhoods.

As you would expect, there are a bunch of people who are not fans of this idea. And as you might expect, they belong to existing neighborhood organizations in well established (but I would argue not traditional) residential neighborhoods. As Whitney Bowerman argued in this excellent email she sent to the planning commission, these organizations represent mostly older homeowners who want to preserve the low-density character of their neighborhoods.

This testimony to the planning commission I think almost perfectly encompasses this attitude.

First off, she makes a point that we shouldn’t follow the example of Seattle. Implying that by increasing density you don’t do much to decrease housing costs. The fact is that rents and housing costs have started to decline in Seattle, mostly because of all those cranes on the skyline are starting to make a dent in demand.


Renters are not bad, I’m a renter

About two minutes into her testimony, she starts to get into a caricature of homeownership. “For generations, working people have dreamed of owning a house,” she said. Specifically a house, and in her mind, a detached single family home. Which is also a specific type of home that hasn’t been historically accessible to many people or even now.

“It is not just a financial investment, it is an emotional investment and a social investment as well,” she said. Apparently, when you own a home, your emotions should matter more and your memories are deeper and richer.

“Outside those walls and over the fences, they (homeowners) create social networks,” she said. “Perhaps not in the days of old when someone was home and could build social capital in the neighborhood, but people do participate in Nextdoor, attend annual meetings… they are literally invested in their neighborhoods.”

This is all a slam on the nature of renting a home. Personally, I’ve done both. I’ve rented in almost every quadrant of Olympia and owned two homes in East Olympia. Currently, I rent an apartment in Southeast Olympia and hope one day to own again, but not a single family detached home. My goal is a townhouse with as little yard as possible.

But this belies the philosophy behind this anti-density testimony. The neighbor I had that called me a piece of shit while I was outside with my toddler owned his home. He still owned it when the police arrested him for waving a gun at his wife. I’m sure he had memories in my neighborhood, but they weren’t more meaningful because he paid a mortgage.

I’ve also had a series of neighbors that have quickly moved in from out of state, bought a home and relatively quickly moved out without making a dent in my community. They were not literally invested in anything and their presence, while pleasant, did not have a deeper impact on the neighborhood.


It isn’t about renters vs. homeowners, it’s about density and affordability

I agree the research indicates that homeownership by-in-large means better things for a community.

The testimony is also moving the ball from a debate on increasing density in Olympia’s low-density neighborhoods to a debate over the value of homeowners vs. renters. At least in the examples of townhomes and possibly courtyard apartments, the Missing Middle will be the only actual path to homeownership that some people can ever use. And, the option of duplexes and ADUs will possibly allow some folks, who would like to set down permanent roots in a neighborhood, stay in a neighborhood.

Imagine for a moment a single mother who got a late start on retirement. She has an addition in her small home that she can easily transition into an ADU if it was allowed by the city. That would keep her in her home past retirement.

Currently, a lot of neighborhoods in Olympia fail the test of liveability in two major ways. They are too low density to really be considered walkable. Even if a small neighborhood center like Wildwood did want to located inside some of these neighborhoods, it wouldn’t survive because single-family neighborhoods simply aren’t dense enough.

Also, we fail in terms of variety of housing types, especially in the car-dependent SE neighborhoods. A good neighborhood ensures that multiple generations of the same family can live in the area, that people from a variety of backgrounds can come together. Large swaths of single-family homes, while protecting the nature of a neighborhood, does not promote diversity.

« Older posts

© 2024 Olympia Time

Theme by Anders NorenUp ↑